
Top 7 Digital Signage KPIs You Need to Track
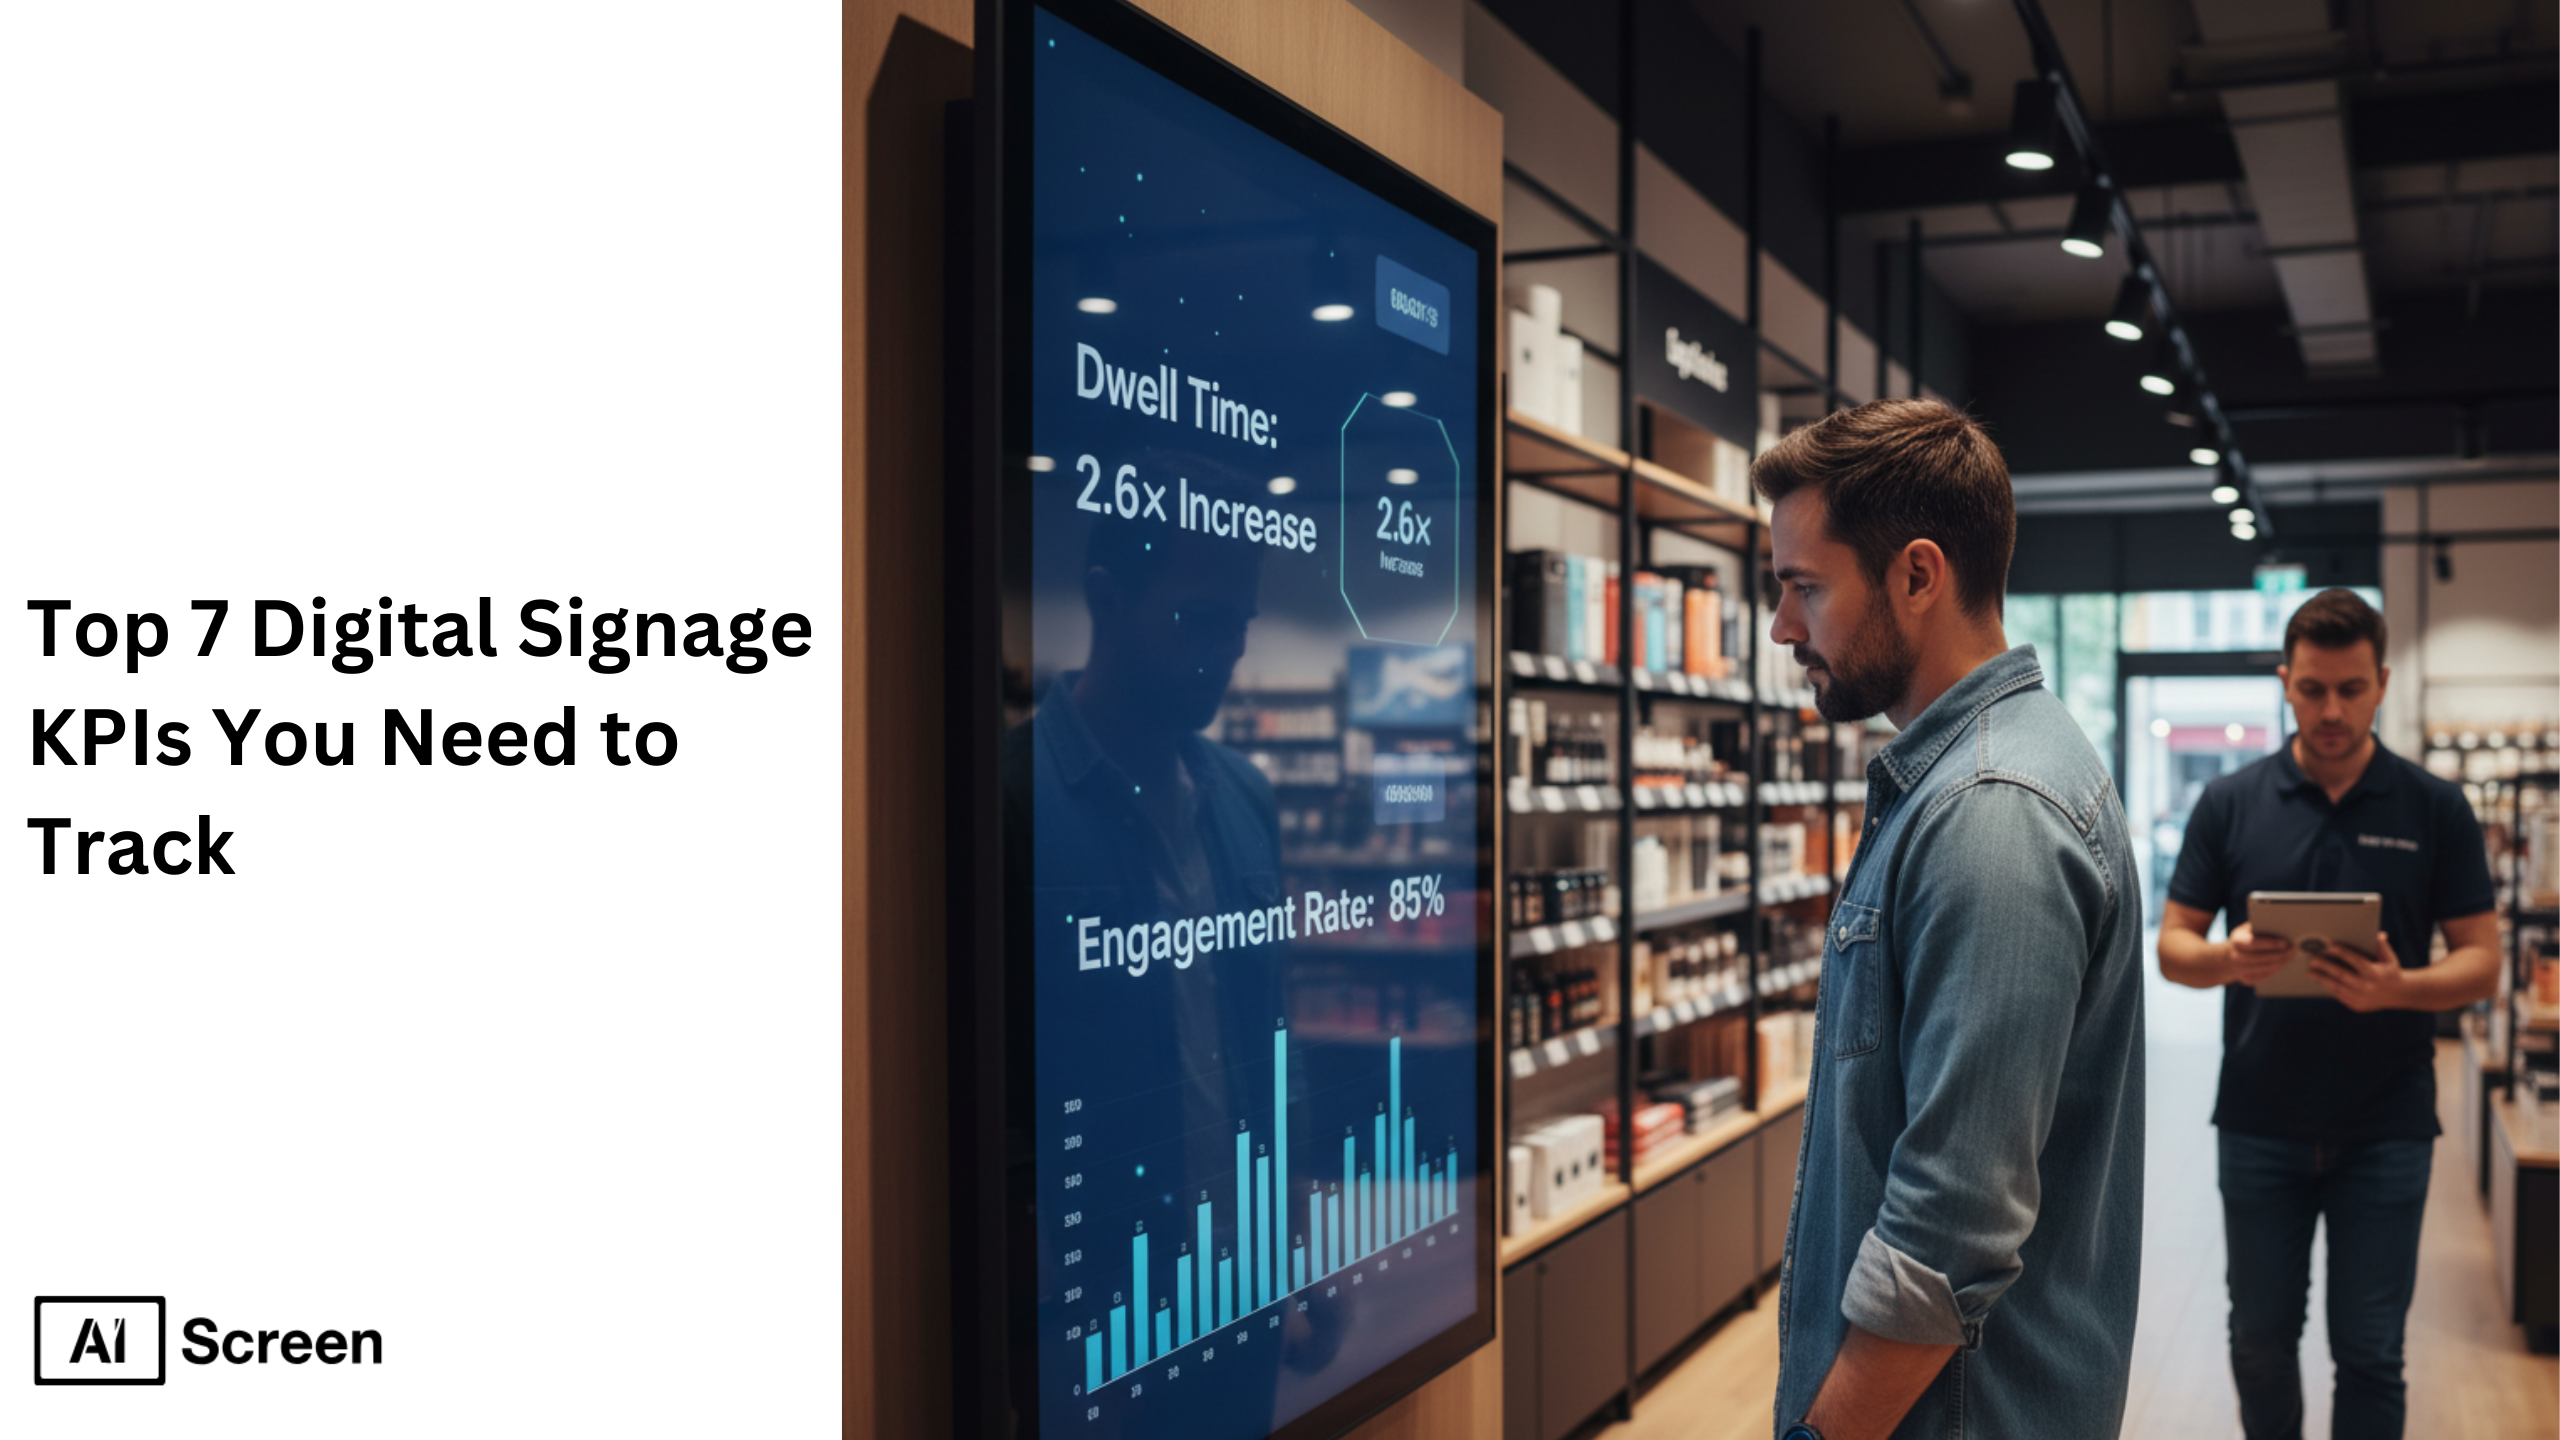
Key performance indicators, or digital signage KPIs, are measurable performance metrics that show how effectively digital signage supports business objectives and improves overall business performance. Tracking these metrics turns digital screens into revenue-oriented communication tools instead of passive displays. According to Digital Signage Today, businesses using digital signage solutions report sales increases of up to 33%, showing the positive impact of measuring performance through data driven decisions.
In this blog, you’ll learn why monitoring digital signage platform performance metrics helps organizations gain valuable information, identify areas for improvement, and support revenue oriented performance measurement. We’ll also explore seven essential key performance indicators (KPIs) every marketing team and sales team should track for success measurement, operational efficiency, and stronger customer experience.
1. Dwell Time
Dwell time is an important KPI that measures how long a viewer spends looking at digital displays or interactive displays. This metric provides critical data about audience attention and helps businesses measure success in advertising campaigns.
Longer dwell time usually signals that content resonates with the target audience and improves visitor flows within retail or public spaces. When customers find content valuable, they stay longer and engage more with the advertised product.
Businesses use dwell time for defining KPIs, optimizing content loops, and making data driven decisions about placement and screen visibility. According to ResearchGate, digital displays increase dwell time by up to 2.6× compared with static signage, proving it is a proven method for attracting attention and driving sales.
2. Session Count
Session count measures how many viewers interact with a digital signage platform within a defined period. It represents how frequently customers encounter the same product or advertising message across digital screens.
Tracking session count alongside daily active users and monthly active users provides deeper performance measurement and helps teams analyze foot traffic, peak hours, and engagement levels. Foot traffic lift tracks the increase in visitors to a specific area directly after a signage campaign is launched.
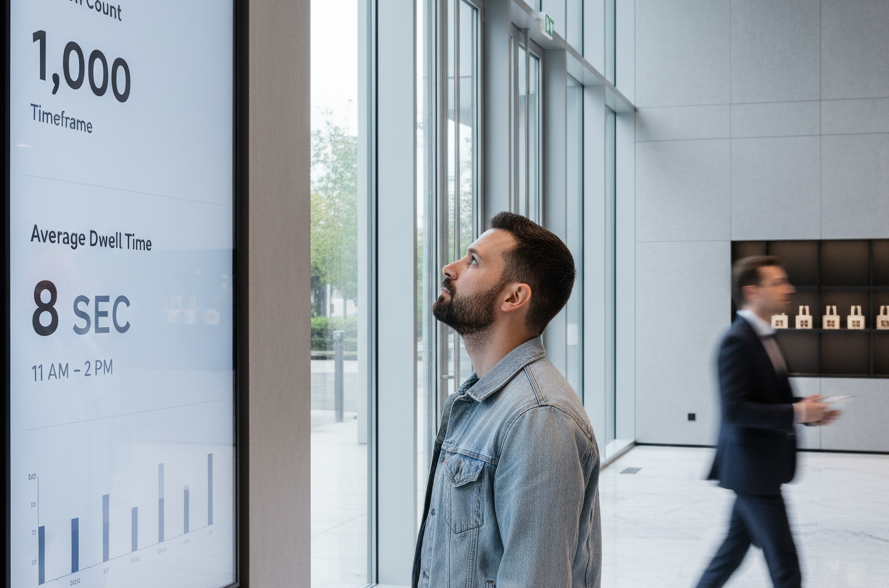
For example, a store might see 1,000 sessions between 11 AM and 2 PM, providing initial data for scheduling campaigns when the target audience is most active.
Combining session data with dwell time helps marketing teams gain actionable insights, identify good KPIs, and align campaigns with business objectives such as increase revenue, driving sales, or improving the company’s image.
3. Conversion Rate
Conversion rate directly connects digital signage KPIs to sales, making it a critical part of revenue oriented performance measurement. This KPI tracks how many viewers become paying customers after interacting with content through QR codes, promo links, or interactive campaigns.
When businesses analyze conversion rate, they gain valuable information about which advertising campaigns deliver results and which ones require product improvement or adjustments.
Higher conversion rates often indicate that products valuable to customers are being promoted effectively, supporting strategies like cross selling, loyalty programs, and increasing average sales.
Using digital signage for performance measurement fosters a culture of transparency and accountability within organizations.
Monitoring this KPI helps organizations evaluate marketing investments and identify important KPIs that contribute to target achievement and business growth.
4. Engagement Rate
Engagement rate measures how often users interact with interactive displays, QR codes, or touch features on digital signage. This KPI reveals whether audiences simply pass by digital screens or actively participate in content experiences.
Interactive polls, product previews, or touch-enabled displays create new possibilities for communication and provide critical data sources about customer behavior.
Research shows that organizations using digital signage for internal communication see employee engagement increase by 25%, demonstrating the many benefits of interactive digital communication.
Tracking engagement alongside dwell time and session count gives teams valuable insights, helping team members stay on the same page and make informed decisions about content strategies.
5. Click-Through Rate (CTR)
Click-through rate (CTR) measures how many viewers take action after seeing content on digital signage displays. A strong CTR indicates that advertising messages, CTAs, and visuals resonate with customers and support advertising measures focused on driving sales.
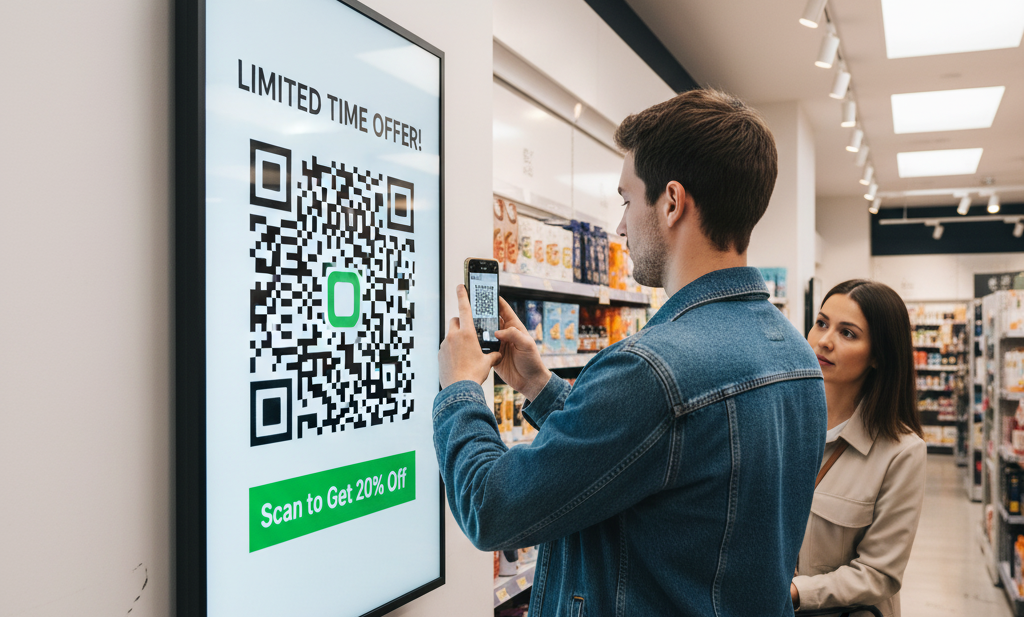
Marketing teams often perform A/B testing on visuals or calls-to-action to improve CTR and increase engagement. Combining CTR with real time data and analytics tools helps organizations gain actionable insights and refine campaigns for better customer satisfaction and stronger brand impact.
For deeper analysis of CTR and engagement metrics, businesses can also explore digital signage analytics for retail: a detailed guide, which explains how analytics improves marketing performance.
6. Recall Rate
Recall rate measures how well audiences remember the message displayed on digital signage after exposure. This KPI plays an important aspect in brand building because strong recall improves customer loyalty and encourages repeat buyers.
Brands measure recall through follow-up surveys, quizzes, or interactive campaigns that gather valuable information about audience perception. Higher recall improves the company’s image, strengthens brand awareness, and ensures the advertised product remains memorable among different product groups.
When recall rate improves, businesses know their digital marketing strategies create a positive impact on long-term customer relationships.
7. ROI (Return on Investment)
Return on Investment (ROI) combines multiple key performance indicators KPIs to evaluate the overall effectiveness of digital signage initiatives. By analyzing metrics such as conversion rate, engagement, and operational costs, companies can determine whether their digital signage solutions deliver measurable results.
A 2023 Deloitte report found that companies using data driven decisions achieve 20% higher ROI, proving that analytics is a proven method for improving business performance. ROI also provides insight into customer effort score, customer satisfaction, and operational efficiency, helping leaders identify areas for improvement.
For a deeper understanding of ROI measurement strategies, businesses can explore how to measure return on objectives in digital signage, which explains how KPI tracking connects campaigns to measurable results. Monitoring ROI ensures every display contributes to increase revenue, supports target achievement, and keeps digital campaigns aligned with long-term business objectives.


Why Do KPIs Matter in Digital Signage?
Tracking digital signage KPIs enables organizations to gain primary information about audience behavior and campaign effectiveness. Measuring performance metrics helps teams identify underperforming content, adjust strategies, and improve the customer experience.
PosterBookings reports that organizations using digital signage for internal communication experience 27% higher employee engagement, highlighting the positive impact of tracking relevant metrics. Digital signage can encourage healthy competition among employees by displaying performance metrics.
Ultimately, KPIs help businesses make informed decisions, support decision making, and ensure marketing efforts stay aligned with strategic goals.
How Do Customer Interactions Affect KPI Selection?
Customer interaction levels directly shape how businesses define and measure key performance indicators (KPIs). Different industries use distinct metrics based on audience type, environment, and communication goals. Understanding these variations helps ensure marketing efforts and content strategies align with customer satisfaction and overall business objectives.
- Retail: Focuses on dwell time, conversion rate, and CTR to analyze visitor flows and sales activity. These KPIs reveal how effectively screens capture attention and drive transactions among customers.
- Corporate / HR: Prioritizes engagement and recall to gauge internal communication success, boost morale, and monitor overall performance.
- Education / Healthcare: Emphasizes awareness and communication reach, ensuring the right metrics measure how information impacts different product groups or audiences.
In every case, selecting important KPIs depends on the interaction environment, whether it’s a high-traffic retail store, a quiet corporate lobby, or a learning campus. The normal course of customer engagement determines which data points will most effectively reflect results.
What Makes a Good KPI? (S.M.A.R.T. Framework)
To ensure measurable success, key performance indicators (KPIs) should follow the S.M.A.R.T. framework, Specific, Measurable, Achievable, Relevant, and Time-bound. This model ensures digital marketing and operational efficiency align with clear business outcomes.
For example:
“Increase content engagement rate by 20% in 30 days.”
“Reduce customer acquisition cost by 10% within one quarter.”
These displaying KPIs provide valuable information for decision-makers and the marketing team, ensuring every goal is actionable and results-driven. A SMART KPI gives the sales team a clear path to success while improving customer experience, average sales, and net promoter score (NPS).
Applying SMART logic helps organizations use real-time data to improve customer effort score, optimize marketing expenses, and align each campaign with company goals.
Customer-Facing vs. Internal KPIs in Digital Signage
In digital signage, success depends on tracking the right metrics for both your audience and internal operations. Customer-facing KPIs measure how well your screens influence engagement and conversions, while internal KPIs ensure the network performs smoothly behind the scenes. Together, they create a balanced system for measuring effectiveness and improving overall performance.

Customer-Facing Metrics
Metrics such as conversion rate, engagement rate, recall rate, and foot traffic help businesses understand how audiences respond to content and campaigns. These relevant KPIs reveal whether your digital marketing messages are grabbing attention, encouraging action, and improving the customer experience.
Tracking these metrics offers insights into website traffic, brand awareness, and sales, making it easier to measure campaign success and identify what truly resonates with your customers. Monitoring these important KPIs allows marketing teams to refine visuals, CTAs, and content strategy for maximum engagement.
Internal Team Metrics
While customer-facing metrics assess audience response, internal KPIs track system reliability and operational performance. Key indicators include content update frequency, system uptime, network performance, and response to alerts. These help ensure your signage operates seamlessly across all displays, minimizing downtime and optimizing delivery.
Strong internal metrics also reflect your team’s ability to maintain efficiency while managing customer acquisition cost and supporting real-time updates. Understanding these important KPIs helps your organization stay proactive, maintaining consistent quality and performance even as campaigns scale.
How to Set Up KPI Tracking for Digital Signage
Tracking signage performance doesn’t have to be complicated. By following a simple framework, businesses can connect their content with measurable outcomes and improve digital marketing results across all displays.
Here’s a short, actionable setup process:
- Define your signage goals, whether awareness, engagement, or conversions.
- Select KPIs that align with these objectives and reflect your company’s goals.
- Connect your CMS with analytics tools like Google Analytics or Power BI for centralized tracking.
- Automate data collection and reporting to reduce manual work.
- Continuously refine content based on insights from relevant KPIs, what drives engagement, what needs improvement, and how to lower customer acquisition cost.
By aligning the right KPIs with your digital signage strategy, your business gains clarity, enhances website traffic, and boosts sales performance, all while ensuring each display works efficiently and effectively for your customers.
Boost Your Digital Signage Performance with AIScreen’s KPI Analytics!
Maximize the full potential of your digital displays with AIScreen’s intelligent KPI analytics dashboard. Track engagement, dwell time, and ROI in one centralized platform, as we read in the article top 7 digital signage KPIs you need to track. Automate displaying KPIs with real-time data visualization, giving your marketing team and sales department instant insights for faster, more informed decisions.
AIScreen empowers businesses to monitor key performance indicators (KPIs) like engagement rate, recall, and ROI, helping teams identify areas for improvement, reduce marketing expenses, and boost operational efficiency. Start your free 14-day trial today and transform every screen into a measurable performance engine that drives growth, enhances customer experience, and aligns results with your company’s goals.
FAQs
What are digital signage KPIs?
Digital signage KPIs stand for the key performance indicators that measure how effectively digital screens achieve specific goals such as engagement, awareness, or conversions. These metrics give businesses a clear picture of what’s working and what’s not. Simply put, a KPI stands as the foundation for making data-driven improvements in signage performance.
Why should businesses track digital signage performance metrics?
Tracking digital signage performance metrics helps businesses understand the real impact of their screens on audience behavior and ROI. These insights guide smarter content and placement decisions. Since each KPI stands for a measurable goal, tracking ensures your campaigns stay aligned with strategic objectives.
What’s the difference between engagement rate and dwell time?
The difference between engagement rate and dwell time lies in what they measure, dwell time shows how long people watch your screen, while engagement rate measures how actively they interact with it. Together, they provide a full picture of viewer interest and participation. Each KPI stands as a unique measure of how audiences respond to your content.
How can I measure ROI for digital signage?
Measuring ROI for digital signage involves comparing your campaign costs with the revenue or results generated through conversions, leads, or brand exposure. Integrating tracking tools and analytics helps calculate accurate returns. In every case, this KPI stands as proof of profitability and strategic efficiency.
Which tools are best for tracking digital signage KPIs?
The tools best for tracking digital signage KPIs include analytics platforms like Google Analytics, Power BI, and integrated signage dashboards. These systems centralize performance data for easier reporting. Each KPI stands out clearly within these tools, helping you monitor progress and optimize campaigns effectively.
