
What Is POG in Retail Digital Signage? A Complete Guide
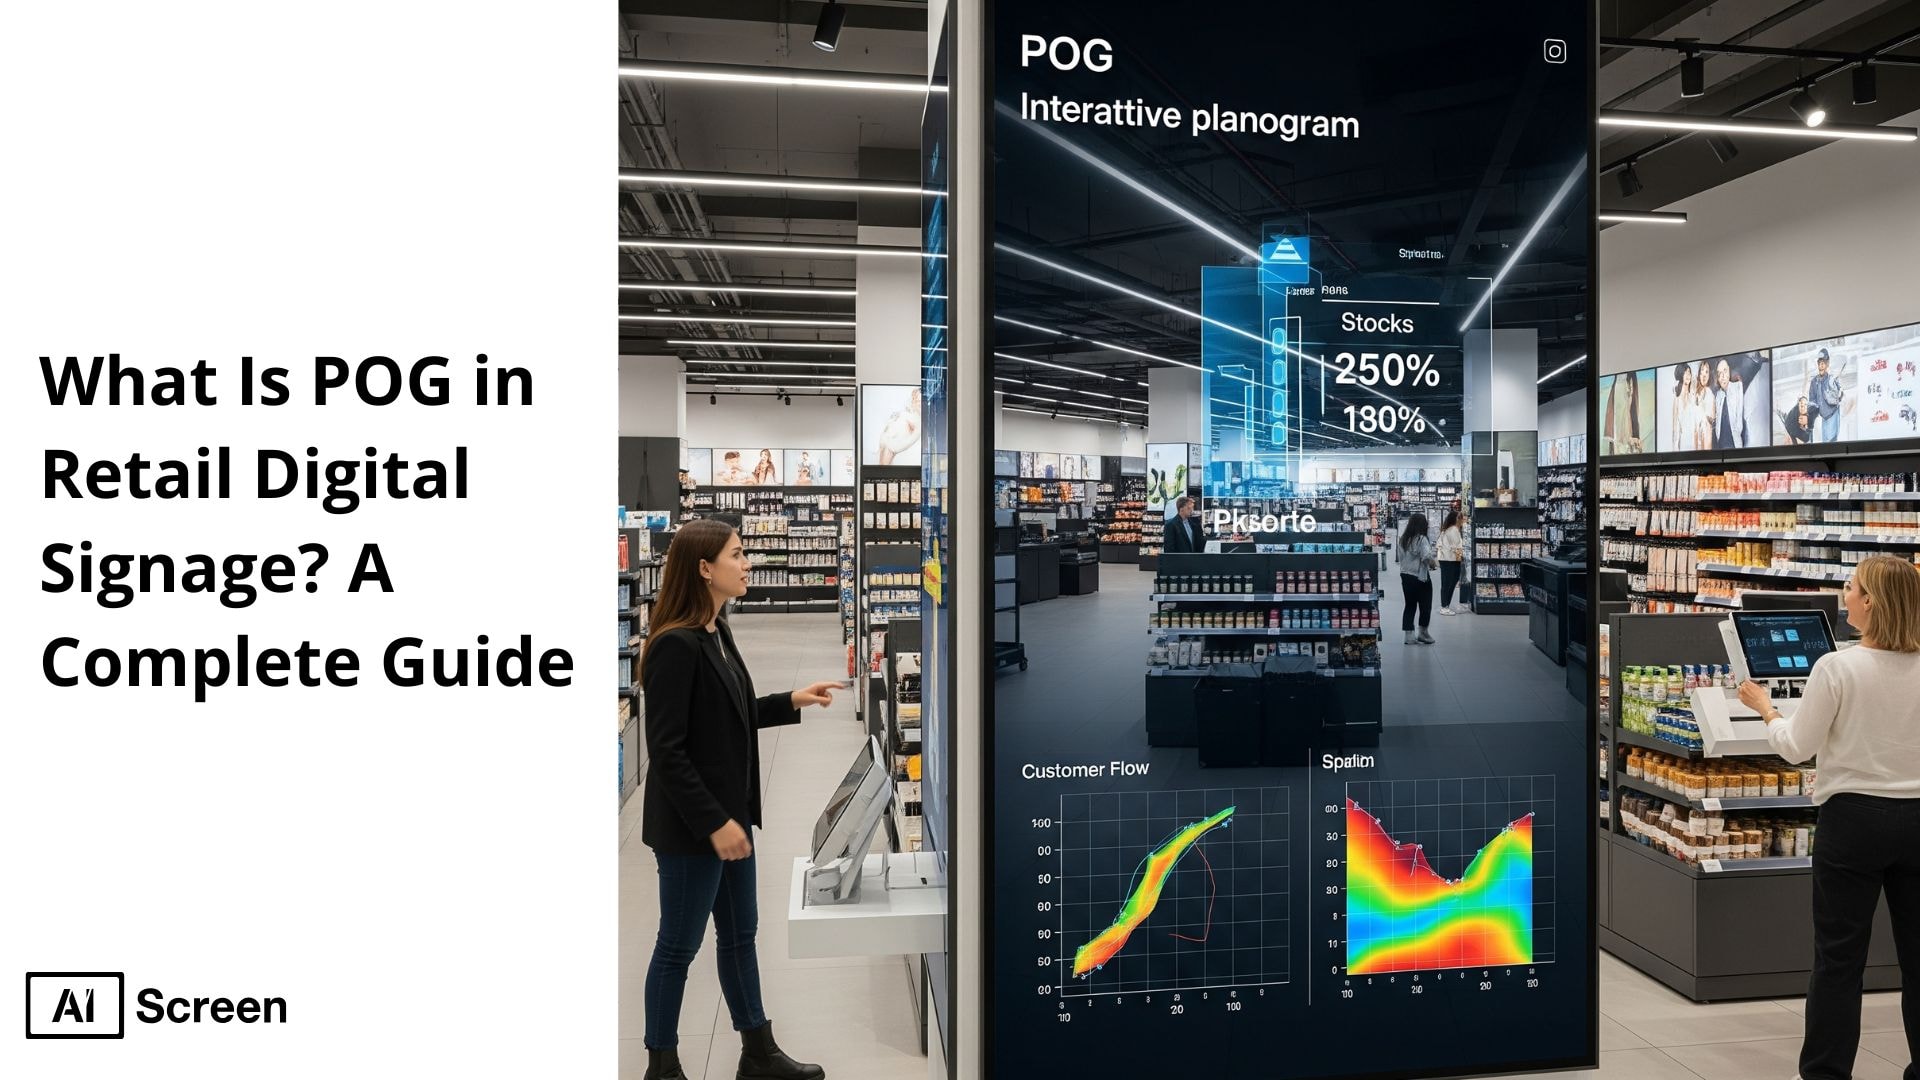
A Planogram (POG) is a powerful visual tool used in retail to optimize product placement and drive sales, and when integrated with digital signage, it can enhance the shopping experience by providing real-time updates and personalized content. In today’s fast-moving retail environment, understanding what is POG in retail digital signage is essential for businesses looking to stay competitive and responsive to consumer behavior. According to Forbes, digital signage integrated with planogram strategies can reduce the time to execute in-store promotions by over 40%.
In this blog, we’ll explore how Planograms work in retail and how digital signage takes them to the next level. You’ll learn about the different types of POGs, their layout strategies, key benefits, and how they contribute to better product visibility and store performance in retail merchandising. Whether you’re managing a small section or an entire store, this guide will help you understand how to use POGs effectively with digital signage for a smarter retail experience.
What Is a Planogram in Digital Retail Signage?
A planogram in digital retail signage is a visual blueprint that outlines where and how products should be displayed on store shelves. This strategy plays a vital role in visual merchandising by enhancing the organization and visual appeal of the retail space, particularly among different product categories. With digital signage integration, POGs are no longer static documents but real-time, adaptable tools that reflect ongoing changes in inventory, customer preferences, and promotional events. According to Deloitte, stores that regularly update planograms using customer behavior data outperform competitors by 7% in gross margins.
Digital signage amplifies the utility of planograms by enabling dynamic content display, automating planogram compliance checks, and supporting real-time content updates. For example, a screen placed above a product section may rotate between planogram instructions, promotional offers, and complementary product suggestions. This fusion of planogram and signage transforms traditional merchandising into a responsive, data-driven system that boosts retail sales and improves customer convenience.
What are the Benefits of POG in Store Digital Signage?
The benefits of using POG (Planogram) strategies in store digital signage go far beyond organization. According to Statista, the global market for retail planogram software is projected to exceed $1.2 billion by 2026, showing growing investment in visual merchandising tools that help to maximize sales.
With digital screens, retailers can optimize shelf space, update layouts instantly, and create a more engaging customer journey, all while supporting sales goals.
- Improved Product Visibility: Digital signage helps highlight key items and best-sellers by drawing attention with motion graphics, animations, or brand visuals. This ensures that customers see high-margin or promotional products first.
- Increased Sales: Strategic product placement combined with screen-based promotions boosts impulse purchases and moves inventory faster. POG-driven digital signage can showcase combo offers or upsell recommendations in real time.
- Real-Time Updates: Instead of reprinting planograms or manually moving items, digital signage can update layouts instantly across stores. This saves time, reduces labor, and allows quicker adaptation to trends or stock changes.
- Customer Experience: A well-organized layout displayed via screens enhances navigation and decision-making. Shoppers can easily locate items, access product info, and enjoy a seamless in-store journey with fewer frustrations.
What are the Types of Planograms?
The types of planograms in retail are generally categorized by their scope and layout. Understanding each type helps retail teams choose the right planogram strategy for specific store sections, product categories, or seasonal campaigns. According to Adobe Analytics, retailers that personalize displays based on real-time analytics, often powered by planogram tools, see a 20% lift in average basket size.
By aligning planograms with store layout and visual merchandising goals, retailers can optimize shelf space, boost sales, and ensure brand consistency.
By Scope
The planogram types by scope define how much of the store the layout will cover. From full-store planning to small display zones, these help retailers organize merchandise at different levels of scale.
- Full-store Planograms: Full-store planograms provide a complete visual layout for the entire retail space, covering all departments and zones. They help maintain consistency in product placement across multiple store locations and are ideal for large-format or chain retailers using digital signage.
- Department Planograms: Department planograms focus on organizing product placement within a specific department, such as the produce section in grocery stores or the beauty aisle in a pharmacy. These help optimize customer flow and improve product visibility in high-traffic categories.
- Section Planograms: Section planograms are used to fine-tune product organization within a smaller category of a department, such as bottled beverages within the drinks aisle. These allow retailers to adjust layouts quickly based on consumer preferences or sales data.
- Display Planograms: Display planograms are designed for temporary promotional spaces like endcaps, seasonal setups, or point of purchase displays. These layouts often support impulse purchases and are commonly used to structure POSM display execution, ensuring promotional materials, signage, and products are positioned for maximum visibility and conversion.
By Layout
The planogram types by layout determine how products are visually arranged on shelves. Vertical, horizontal, and modular styles guide how items are displayed to improve visibility and customer engagement.
- Vertical Planograms: Vertical planograms arrange products from top to bottom on shelving units, making use of vertical space and promoting vertical product placement. These are effective for narrow aisles or wall-mounted displays and often draw attention to premium or eye-level products.
- Horizontal Planograms: Horizontal planograms structure product placement from left to right, optimizing wider shelf space in broad aisles. This layout is common in bulk product areas or categories where visual scanning is easier horizontally, such as snacks or beverages.
- Block Planograms: Block planograms group products into blocks or zones, helping customers quickly find related items. This method is ideal for categories like cleaning supplies or packaged foods where grouping improves usability and product access.
- Brand Block Planograms: Brand block planograms focus on grouping items by brand rather than category. This supports brand visibility, encourages customer loyalty, and strengthens packaging consistency across store shelves for consumer packaged goods.
- Modular Planograms: Modular planograms use a flexible grid structure that can be adapted for different store sizes, product ranges, or promotions. These are commonly used in retail chains where display needs vary by location but require a consistent framework.
- Feature Planograms: Feature planograms highlight key products or promotions such as seasonal items, product launches, or clearance stock. These layouts are typically short-term and are paired with digital signage to attract attention and boost conversion rates.
How to Create Effective Planograms for Retail Store?
Creating effective planograms for a retail store requires a systematic approach that combines data analysis, retail goals, and digital signage tools. This method ensures that shelf space is utilized strategically to maximize sales and enhance customer experience. According to the National Retail Federation, planogram compliance averages only 60%, but using digital tools improves compliance by up to 30%.
A successful planogram design aligns with retail sales data and customer behavior trends while integrating seamlessly with the overall retail store layout.
Gathering and Analyzing Data
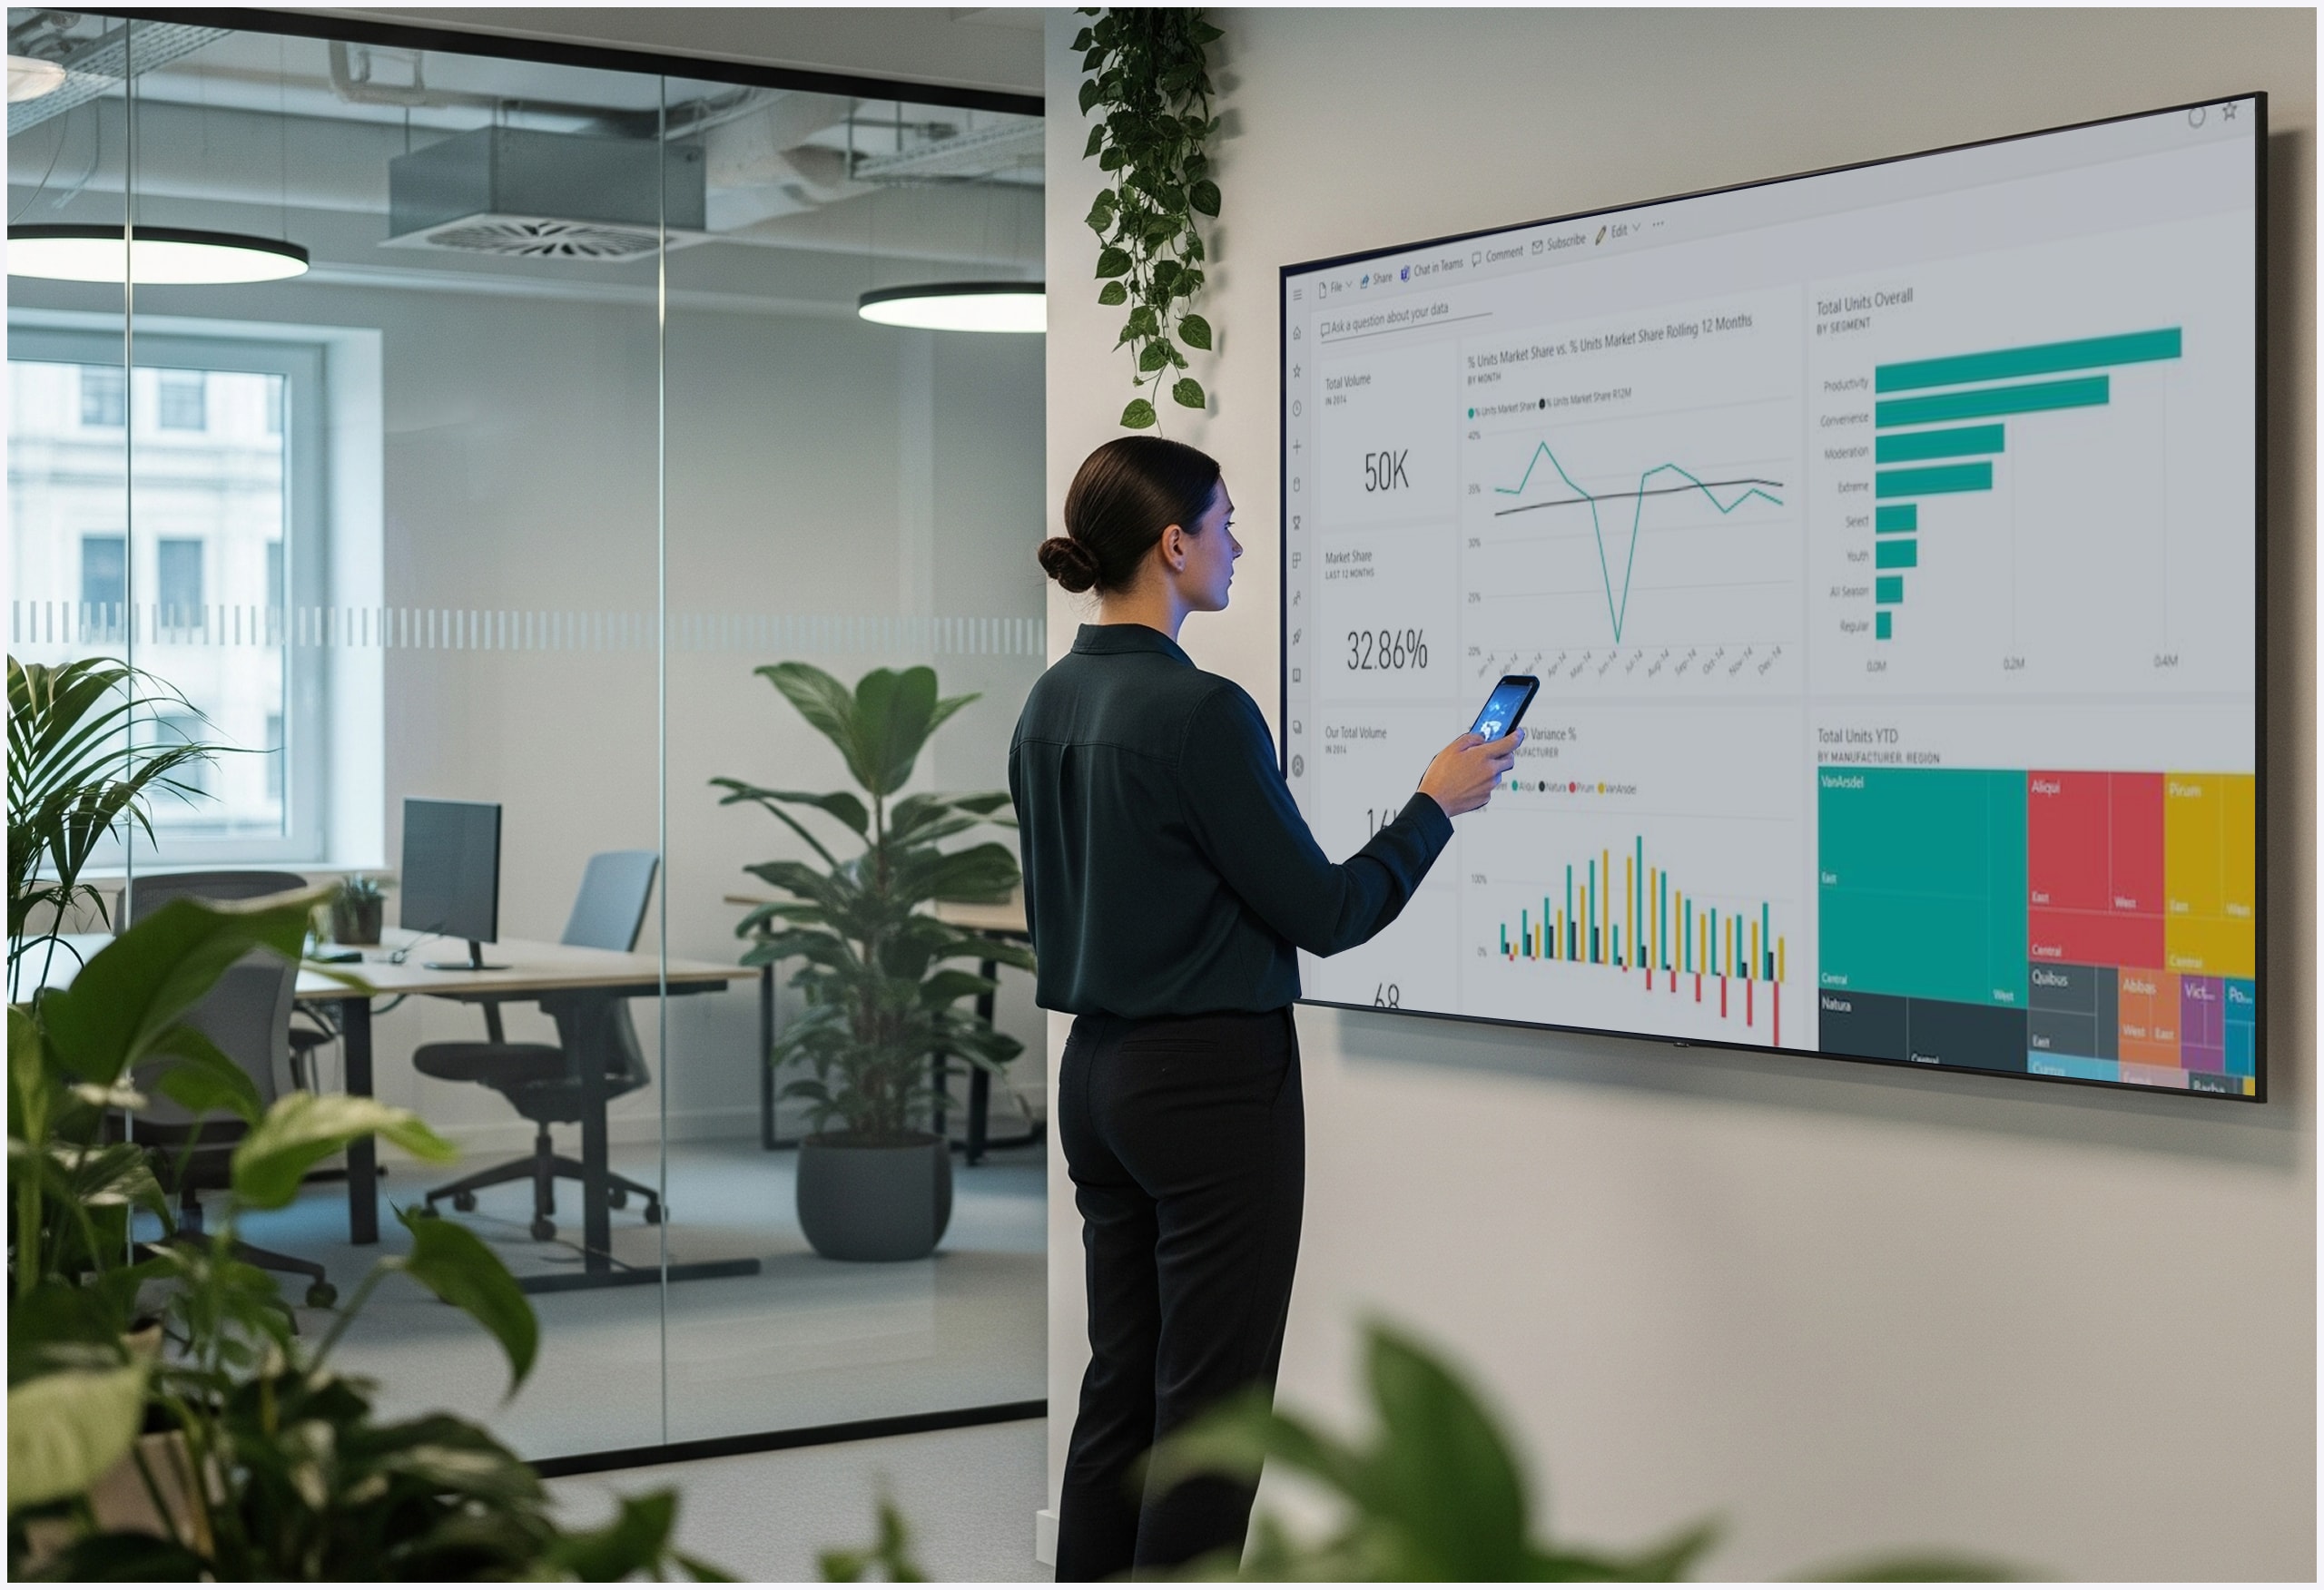
Gathering and analyzing data plays a foundational role in designing planograms that match real-world consumer behavior. Retailers need insights from sales trends, inventory levels, and shopper habits to make informed layout decisions.
Using Power BI for gathering and analyzing data enables retailers to visualize real-time sales and product performance. This helps optimize shelf placement based on actual customer demand.
With Tableau, analyzing data becomes interactive, allowing teams to filter, map, and adapt planogram strategies across departments. Insights from dashboards guide the merchandising team to boost sales.
Retailers turn to Google Data Studio to merge marketing data with product analytics, offering a holistic view. This helps identify which products to prioritize in high-traffic store locations.
Many teams still use a Microsoft Excel Sheet for organizing inventory movement and historical sales data. Excel simplifies early-stage planogram planning by comparing past layouts and results.
Setting Clear Objectives
Setting clear objectives, which are one of the key elements, is essential for effective planogram creation. Retailers must define what they want to achieve, whether it’s increasing sales of high-margin items, improving the shopping experience, or optimizing shelf space utilization. Having well-defined goals helps in selecting the most appropriate planogram type and guides the layout decisions that follow.
Selecting the Appropriate Planogram Type
Choosing the right type of planogram depends on the store’s size, product range, and merchandising strategy. For instance, full-store planograms are ideal for chain stores aiming for consistency, while modular or display planograms work well in specialty retail stores looking for flexible setups. The selection should reflect the needs of the retail business, sales floor constraints, consumer engagement strategies, and include a planogram reset procedure.
Optimizing Product Placement
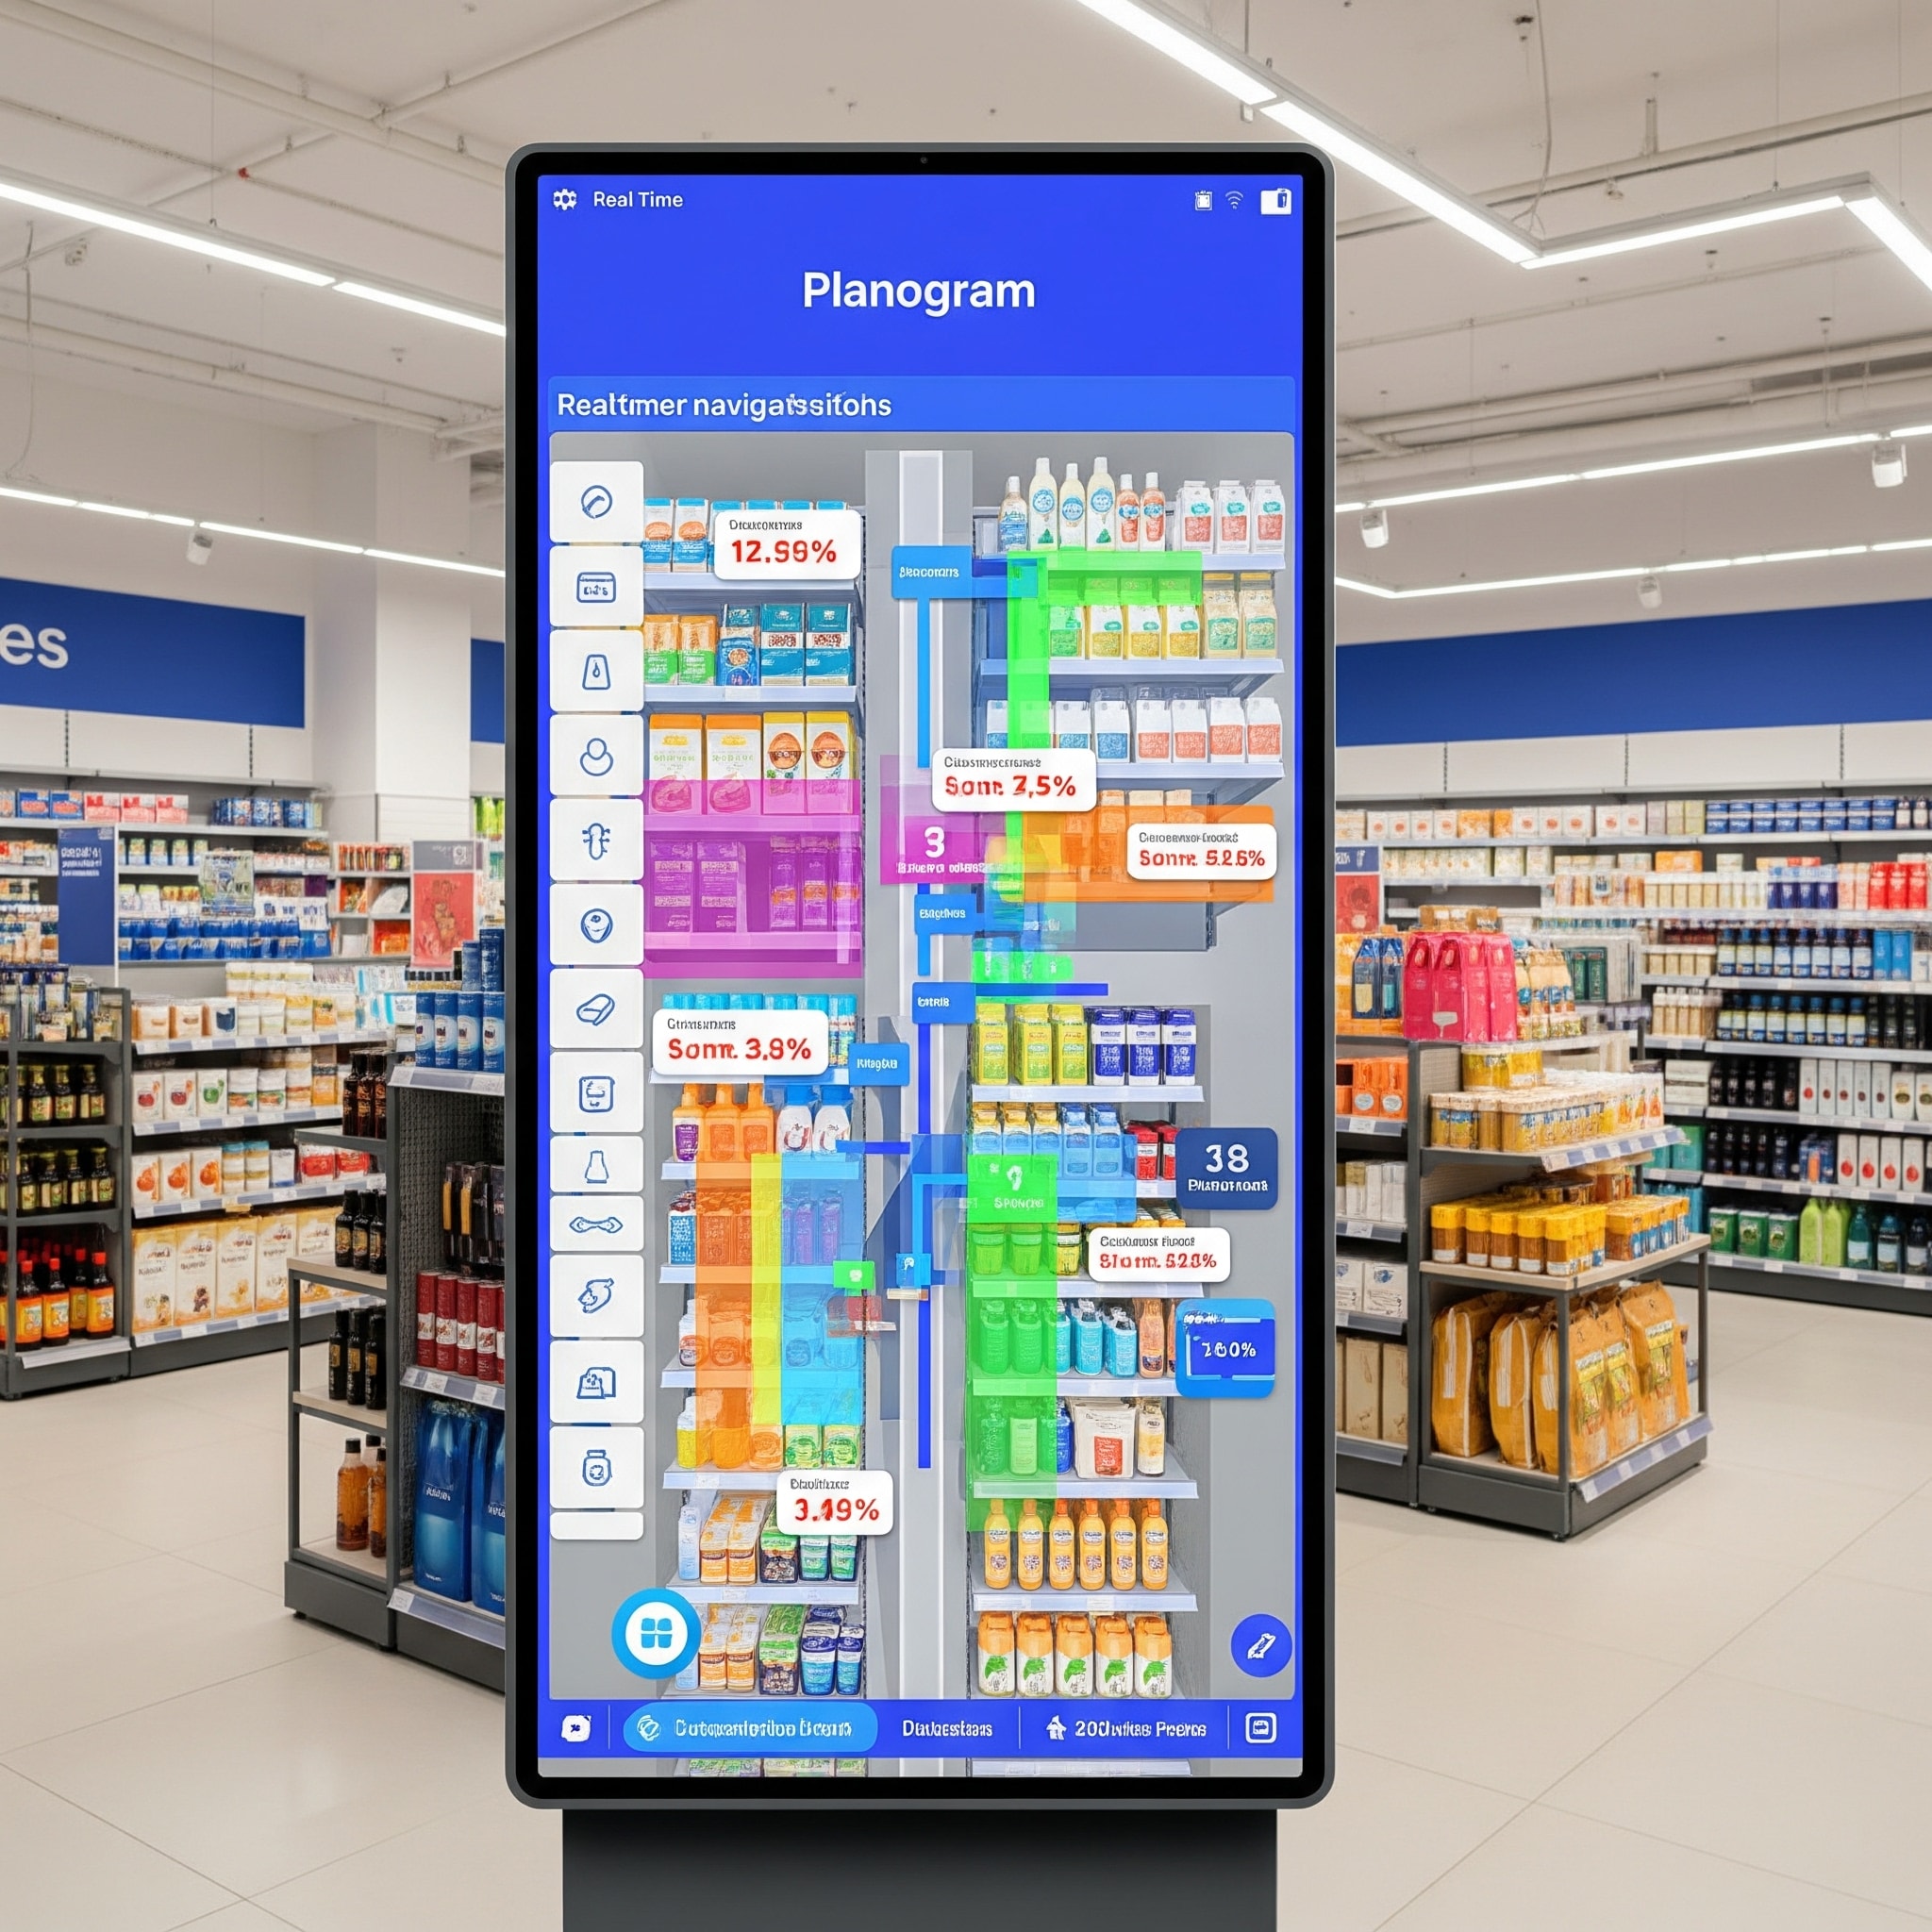
Optimizing product placement means using Planograms to ensure that every item is positioned for maximum visibility and sales impact. Retailers should place high-demand or high-margin products at eye level and in high-traffic areas to optimize sales. Complementary products should be located nearby to encourage bundled purchases at point of sale locations. Proper placement influences customer flow and contributes to an effective store layout that enhances customer convenience and satisfaction.
Utilizing Planogram Software
Utilizing planogram software in retail helps automate the design, execution, and updating of planograms across different store locations. Digital signage platforms like AIScreen make it easier to implement consistent product placements, support inventory management, schedule resets, and align merchandising strategies with real-time sales trends and store layouts.
Integrating planogram software with inventory management and sales tracking systems enhances visibility and control over retail operations. These tools provide actionable insights, helping store teams optimize shelf space, track planogram compliance, and adjust layouts based on actual performance and customer behavior, ultimately to enhance customer satisfaction.
Execution and Communication
Planogram implementation requires clear communication between the visual merchandising team and store employees. Once the plan is ready, it should be displayed on digital signage screens within the store for easy access by staff. Training sessions should be conducted to ensure planogram compliance, and ongoing feedback loops should be established to monitor execution quality and make necessary adjustments based on sales data or seasonal shifts.
What Is the Future of POG in Retail?
The future of POG in retail is shaped by technological innovations such as artificial intelligence, IoT, and advanced analytics. AI-powered systems will soon automate planogram design by analyzing sales trends, customer behavior, and shelf-level data in real-time. This allows retailers to respond quickly to changing consumer preferences and optimize store layout continuously. According to Nielsen, over 60% of purchase decisions are made at the shelf in brick and mortar stores, making planogram execution critical to sales success.
Digital signage will integrate with smart shelf sensors to provide real-time stock levels, triggering planogram resets automatically. These developments will enhance retail management by reducing manual efforts and improving accuracy in planogram design. As customer expectations evolve, the combination of digital signage and intelligent POG will play a crucial role in delivering personalized shopping experiences that drive sales and boost customer satisfaction.
Use POG Smartly with AIScreen’s Digital Signage
Using POG smartly with AIScreen’s digital signage allows retailers to streamline planogram creation and execution across different store locations. AIScreen’s cloud-based platform delivers real-time content updates, integrates with inventory systems, and allows retailers to create their own planogram while ensuring consistent product placement through dynamic screen displays that adapt to sales trends and consumer behavior. According to PwC, retailers that align planograms with local customer preferences achieve 2–3x higher sales conversion rates than those using static, generic layouts.
Retailers can use AIScreen to display dynamic planogram layouts directly on screens in the store, guide staff with visual merchandising tasks, and update promotional planograms without any delay. Whether you’re running grocery stores or specialty outlets, AIScreen ensures planogram compliance and helps you create consistency in the retail environment. Visit AIScreen today and explore how to optimize your planogram with smart digital signage.


Frequently Asked Questions
How does a POG work in digital signage?
A POG works in digital signage by displaying a visual representation of product placement directly on digital screens. This helps guide store employees in positioning items on shelves according to the planned layout and ensures that planogram compliance is maintained consistently across different store locations.
Can POG be used for interactive digital signage?
POG can be used for interactive digital signage by allowing both customers and staff to engage with the displayed planogram content. Interactive touchscreens can show planogram layouts, let users search for products, and provide visual merchandising guidance, making the store layout more user-friendly and informative.
How can I create a POG for retail digital signage?
Creating a POG for retail digital signage involves using planogram software such as AIScreen, Microsoft Excel, or Power BI to analyze sales data and design the optimal product placement layout. After setting clear merchandising goals, the planogram is converted into digital formats that can be deployed across multiple store screens.
How does POG impact sales in retail stores?
POG impacts sales in retail stores by optimizing product visibility and fostering consumer engagement through strategically placed items. It helps highlight high-margin products, encourages impulse purchases, and supports a more organized shopping experience that directly contributes to increased sales performance.
What is the difference between POG and traditional merchandising?
The difference between POG and traditional merchandising lies in the structure and precision of execution. While traditional merchandising relies on manual placement and intuition, a POG offers a data-driven, visual merchandising framework that can be implemented across different store locations using digital signage for accuracy and consistency.
