
How to Measure Digital Signage Return On Objectives

To measure digital signage return on objectives (ROO) set SMART goals that are Specific, Measurable, Achievable, Relevant, and Time-bound, clearly defining what your campaign aims to achieve. Establishing measurable objectives ensures digital signage software delivers quantifiable results. This framework helps businesses stay focused on clear objectives and strategic targets beyond just financial returns. The initial investment pays off quickly through measurable non-financial gains like engagement. For example, Forbes reports that DISPL raised over $2B in 2.5 years using digital signage software to boost purchases by up to 25%.
In this article, you will learn how ROO differs from digital signage ROI. You will study industry examples, and learn how to measure return on objectives in digital signage using AIScreen solutions. You can improve your digital signage campaigns by analyzing feedback and operational improvements data and more. Ready for digital signage success? Let’s begin!
What Are The Differences Between Measuring ROI and ROO in Digital Signage?
The difference between measuring ROI and ROO in digital signage is that ROI measures financial return, while ROO measures whether the screen achieved its intended objective. Return on investment measures the financial success of digital signage by comparing gains to expenses.
In digital signage, Return on investment vs Return on Objective examples can include:
- ROI: Calculating the return on investment after implementing a digital signage marketing campaigns.
- ROO: ROO enables businesses to justify digital signage investments even when direct revenue increases are difficult to quantitate.
- ROI: A restaurant uses roi for digital signage to promote daily specials, to increase sales and a boost in overall revenue.
- ROO: A company implements digital signage to enhance employee engagement by displaying motivational content, resulting in improved team morale and productivity.
AIScreen digital signage software helps businesses measure both more effectively because it gives them one platform for content control, scheduling, screen management, and performance tracking across their digital signage network.
What Are the Digital Signage Return On Objectives Examples?
Examples of return on objectives (ROO) in digital signage include measurable outcomes such as engagement, awareness, communication, or conversions that reflect how effectively digital signage strategy achieves specific goals. These outcomes vary depending on the use case, industry, and business objectives behind the digital signage deployment. A 2010 study by Arbitron found that 70 percent of Americans had seen a digital video display in the previous month, and of those, 47 percent specifically recalled seeing a promotional piece.
- Education: Return on objective can be better student awareness of announcements, fewer missed schedule changes, stronger campus wayfinding, or improved visibility of emergency and event information.
- Retail: Return on objective can be higher foot traffic, longer dwell time, better product attention, stronger promotion engagement, or fewer missed in-store offers.
- Employee internal communications: Return on objective can be faster message visibility, better staff awareness, fewer missed updates, stronger recognition visibility, or improved communication across shared spaces.
- Events and tradeshows: Return on objective can be better attendee navigation, higher booth engagement, stronger sponsor visibility, more event participation, or fewer visitor questions at help desks.
- Hospitality: Return on objective can be better guest guidance, smoother check-in communication, higher awareness of amenities and promotions, or a stronger arrival experience for visitors.
AIScreen’s cloud digital signage software helps make ROO easier to apply across different business environments because it supports content management, scheduling, screen control, and multi-location communication from one system. That gives organizations a more practical way to align the screen strategy with the objective being measured, whether the goal is awareness, engagement, navigation, internal communication, or guest experience.


How To Measure Digital Signage Return On Objectives Effectively?

To measure digital signage return on objectives effectively define the objective first, match it to the right KPI, and then track whether the screen improved that outcome over time. The measurement only works when the objective and the result are directly connected, such as foot traffic for awareness, dwell time for engagement, recall for communication, or fewer missed updates for internal messaging.
To measure success of ROO in digital sign, one should have a deep understanding of diverse industries and their working & performance metrics and analysis patterns to gauge overall effectiveness.
Education Return on Objective

Education measurement of digital signage return on objectives (ROO) focuses on evaluating how effectively digital displays improve communication, student engagement, and participation in academic and campus activities.
- Student engagement tracking: Measure interaction with announcements, events, and academic content displayed across campus screens.
- Event participation rates: Analyze attendance changes for workshops, seminars, or activities promoted via digital signage.
- Content recall measurement: Use surveys or qualitative feedback to assess how well students remember key messages.
- Communication reach analysis: Track how many students are exposed to announcements across different campus locations.
- Feedback collection: Gather student input on clarity, usefulness, and relevance of displayed content.
AIScreen’s education digital signage solution helps make education ROO easier to measure by supporting faster campus communication, clearer visual guidance, and more reliable screen control across buildings. AIScreen helped organizations achieved up to 46% faster information delivery, 37% higher student engagement, and 43% reduction in printing and manual effort.
Retail Return on Objective

Retail measurement of digital signage return on objectives (ROO) focuses on understanding how digital displays influence customer behavior, product interest, and in-store decision-making across different touchpoints.
- Sales uplift tracking: Compare product sales before and after digital signage campaigns to identify impact of digital signage. A sales lift is the increase in sales of items promoted on screens.
- Foot traffic analysis: Measure changes in store traffic and movement patterns around digital displays.
- Conversion tracking: Customer engagement can be measured by dwell time and interaction rates such as QR code scans.
- Product-level performance: Track sales of specific items featured on digital signage content.
- Customer journey mapping: Assess how digital signage affects navigation and time spent in different store areas.
Employee Internal Communications Return on Objective
Employee internal communications measurement of digital signage return on objectives (ROO) focuses on evaluating how effectively internal messages influence awareness, alignment, and action across teams and departments.
- Announcement acknowledgment tracking: Track whether employees notice and acknowledge policy changes, compliance notices, and HR announcements.
- Training and compliance completion rates: Evaluate if digital signage improves mandatory training or internal programs.
- Internal campaign participation: Monitor employee participation in wellness programs, surveys, or company events.
- Message recall accuracy: Assess whether employees understand and retain key messages through quick pulse surveys or quizzes.
- Action-driven behavior tracking: Analyze whether signage prompts specific actions like logging into portals, attending meetings, or following internal processes.
Events and Tradeshows Return on Objective
Events and trade shows Measurement of digital signage return on objectives (ROO) focuses on measuring how effectively digital displays attract attendees, increase sponsor visibility, and drive meaningful interactions during the event life cycle. Events and trade shows reduce up to 30% of the perceived waiting times for the visitors (AVIXA) when they use an event digital signage solution. The tracking measures are:
- Track booth foot traffic: Measure the number of visitors attracted to booths promoted through digital signage.
- Analyze sponsor visibility: Evaluate how often sponsor content is displayed and noticed by attendees.
- Monitor attendee engagement: Assess interactions with digital displays, presentations, or interactive content.
- Measure lead generation: Track sign-ups, inquiries, or contacts generated through signage campaigns.
- Assess post-event satisfaction: Use surveys and feedback to measure attendee and sponsor experience.
Hospitality Return on Objective
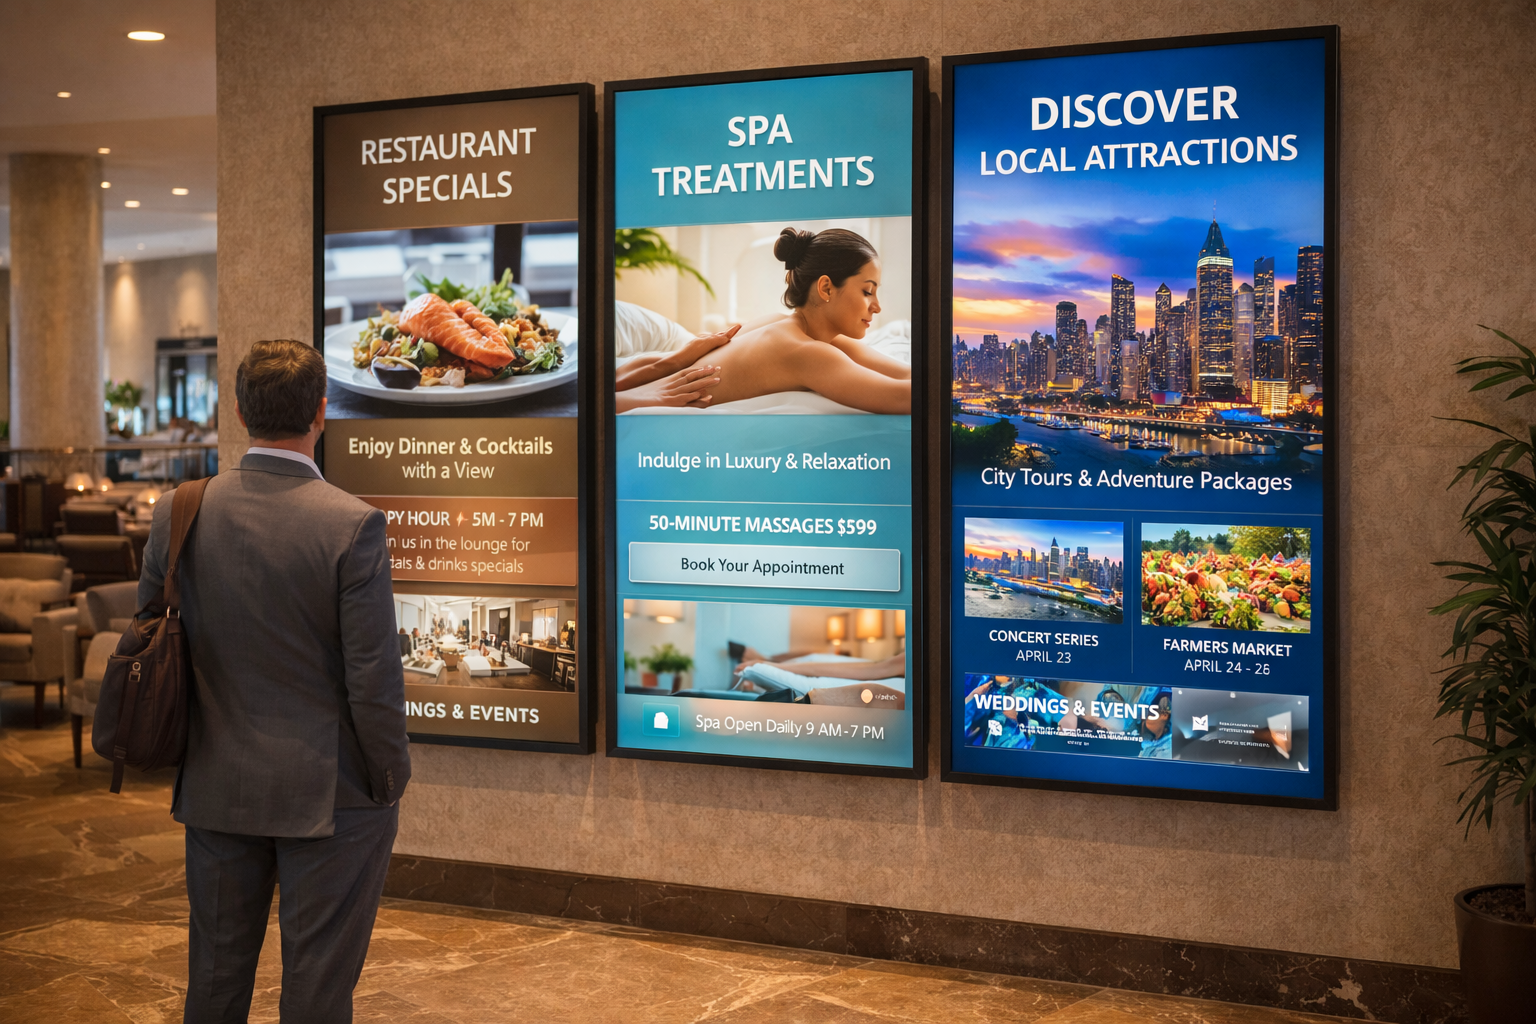
Hospitality measurement of digital signage return on objectives (ROO) focuses on analysing how effectively digital displays enhance guest experience, streamline service operations, and influence on-site spending across hotels, restaurants, and public spaces.
- Guest journey efficiency tracking: Measure how digital signage improves navigation, check-ins, or wayfinding across lobbies and facilities.
- Upsell and cross-sell performance: Track purchases influenced by menu boards, promotions, or in-room digital displays.
- Queue and wait time reduction: Evaluate whether signage reduces perceived or actual wait times in reception, dining, or service areas.
- Service adoption rates: Measure usage of promoted services such as spa bookings, events, or amenities highlighted on displays.
- Guest engagement with content: Analyze interactions with menus, offers, or local information shown on digital screens.
AIScreen digital signage CMS helps teams organize ROO-focused content by audience, location, and objective, which makes it easier to match the screen message to the result being measured. That is useful when schools, retailers, employers, event teams, or hospitality operators need to track whether the displayed content improved awareness, participation, recall, engagement, or action.
How to Calculate ROO of Digital Signage?
To calculate ROO of digital signage, collect data and monitor engagement metrics like interaction time and customer feedback scores. Tracking tools such as cameras, sensors, and digital signage analytics software are essential for gathering engagement data.
Utilize surveys and data-driven decisions to analyze brand awareness and customer satisfaction to gain complete insight into overall success. Conducting focus groups provides deeper qualitative insights into viewer reactions and preferences.
What Metrics Are Used to Measure Return on Objectives (Roo) in Digital Signage?
Return on objectives (ROO) in digital signage is measured using a combination of engagement, content performance, operational, and business outcome metrics that indicate how effectively digital signage systems achieve their intended goals. These metrics help evaluate user interaction with digital signage content, performance across multiple screens, and the overall impact on objectives such as engagement, awareness, and conversions.
Audience Engagement Rate in Digital Signage
Audience engagement rate measures how actively viewers interact with digital signage content. It reflects attention, interaction levels, and overall user interest.
Content Interaction Rate in Digital Signage
Content interaction rate tracks specific user actions such as clicks, touches, or scans. It helps evaluate how engaging and actionable the content is.
Conversion Rate from Digital Signage
Conversion rate measures the number of users who take a desired action after viewing digital signage content. This includes purchases, sign-ups, or inquiries.
Audience Reach and Impressions in Digital Signage
Audience reach and impressions measure how many people view the digital signage content and how often it is displayed. These metrics indicate visibility and exposure.
Dwell Time in Digital Signage
Dwell time measures how long viewers stay engaged with digital signage displays or content. A longer dwell time indicates better intended audience attention. It directly influences your messaging and how users respond to digital content.
AIScreen digital signage analytics helps make these ROO metrics more actionable because the platform measures footfall, age and gender distribution, dwell time, attention time, conversion duration, and A/B testing response in one system. That gives teams a clearer way to connect audience engagement, reach, content performance, and conversion-related behavior to the actual objective behind the signage strategy.
How Is Return on Objective Measured in Warehouse Digital Signage?
Return on objective in warehouse digital signage is measured by tracking whether the screens improve the operational result they were meant to support. That can include better safety awareness, faster message visibility, fewer missed updates, stronger shift communication, clearer task guidance, reduced confusion in work zones, or improved response to alerts and workflow instructions.
The measurement becomes more effective when the objective is defined before the signage is deployed and then checked against a clear before-and-after result. In warehouse environments, that often means reviewing whether the signage improved worker awareness, reduced delays, strengthened compliance communication, or made daily operations easier to manage through visible, location-based messaging. For a deeper setup and strategy guide, see why use digital warehouse signage software.
Start Measuring Your Digital Signage ROO with AIScreen Today
You can now measure your digital signage ROI with AIScreen beyond scheduling. This includes tracking customer engagement, foot traffic, dwell time and sales conversions. Our AI-powered digital signage platform offers customizable dashboards, predictive analytics, and automated reporting. You can track key performance indicators related to you business using this powerful tool with initial digital signage investment.
Use cloud-based signage solutions to monitor the impact of digital signage with ease and precision and get faster internal updates and higher engagement. We provide businesses with powerful analytics tools that maximize cost-effectiveness lower maintenance costs, achieve cost savings while adapting to campaigns quickly. The benefits outweigh the costs. Digital signage eliminates printing costs for static signage, saving thousands annually. Measure digital signage roo with AIScreen now!
FAQs
Can I track both ROI and ROO for the same digital signage campaign?
Yes, you can track ROI and ROO for the same digital signage campaign, and you should actually do this. Calculating ROI helps you assess the financial impact of your campaign, whereas ROO focuses on goal fulfillment, such as navigation ease or customer engagement.
What are common objectives for digital signage in retail?
The common objectives for digital signage in retail include increasing foot traffic, improving campaign recall, streamlining product navigation, and enhancing customer engagement and experience.
How do I track the success of digital signage in events?
You can track the success of digital signage in events by using metrics like sponsor visibility, attendee satisfaction, space utilization, and social media engagement.
What tools can I use to measure ROO for digital signage?
The tools you can use to measure ROO for digital signage are Zight, Looker Studio, and Google Analytics. These tools are integrated into analytics software supporting your signage platform or third-party subscriptions.
How can I optimize my digital signage to improve ROO?
You can optimize the digital signage to improve ROO by using targeted content, scheduling content updates based on traffic data, and then testing different formats to understand viewer interaction. Use a combination of data analysis and content creation to boost results.
