
How to Share Project Management Dashboards to Digital Signage

Sharing project management dashboards to digital signage screens helps keep teams aligned by displaying project progress, KPIs, and timelines in real time. These visual dashboards provide an at-a-glance view of performance, helping teams quickly identify blocked tasks, track priorities, and stay focused on shared visibility goals. According to Gartner, organizations using real-time dashboards and visual performance indicators improve decision-making speed by up to 30%.
This article explains what project management dashboards are, why they matter, and how to share them through digital signage for improving team collaboration, transparency, and communication. By sharing real-time project data on large screens, teams can make data-driven decisions, track project status, and keep everyone informed without relying on manual updates.
What Is a Project Management Dashboard?
A project management dashboard is a visual tool that displays critical project information in a clear overview and high-level overview format, including project success status, key projects metrics performance indicators, deadlines, and overall progress. It helps teams and managers quickly understand how projects are performing by tracking different metrics and monitoring the project’s health, without digging through multiple reports or spreadsheets. According to PMI, 54% of managing projects fail due to poor communication and lack of visibility.


How to Create and Share Multi-Project Dashboards with Digital Signage
To create and share multi-project dashboards via digital signage, you can make all your project success updates and KPIs visible in real time for the entire office. This approach ensures teams stay aligned, track project progress efficiently, monitor active managing projects, and track progress projects in real time for better visibility into project health and performance metrics, enabling data-driven decisions without manual updates.
Using digital signage software for dashboard creation, simplifies integration, enables easy layout customization, and allows dashboards to be shared across multiple screens. It helps teams stay aligned by supporting better project teams success planning and capacity management. These dashboards also improve resource allocation, including workforce, budget, and project teams tasks.
Learn how to create and share multi-project dashboards with digital signage by checking out our guide on setting up the dashboards feature.
Here’s a step-by-step approach:
Step 1: Choose the Best Digital Signage Display for Project Dashboards
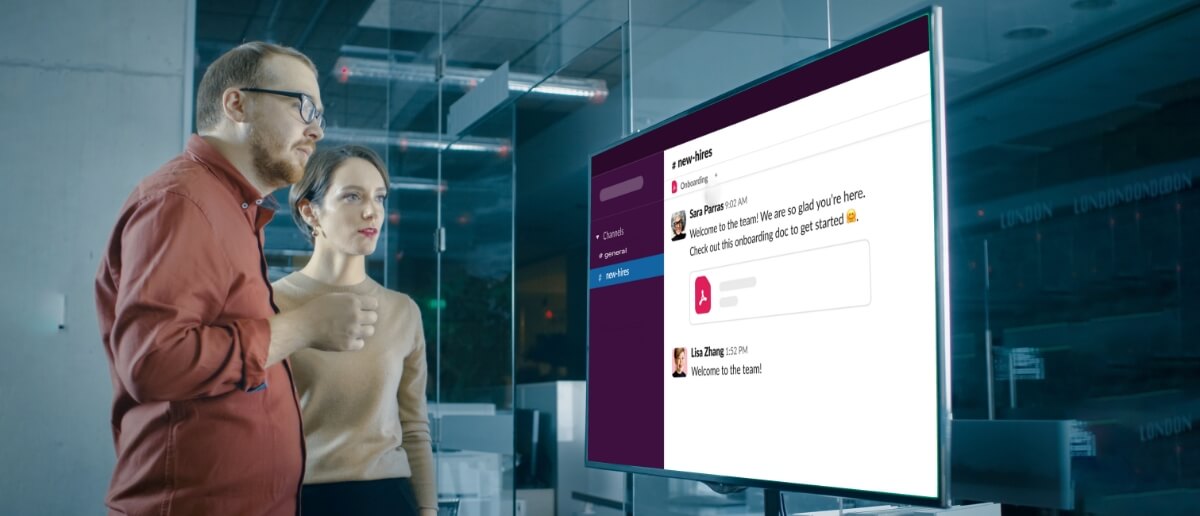
Choosing the right digital signage display depends on size, resolution, location, and visibility. Larger screens are ideal for team rooms where multiple departments can view dashboards at once, while smaller screens might work better in managers’ offices for detailed project information, similar to how you would evaluate digital signage TVs for conference rooms.
Step 2: Set Up Digital Signage Software for Multi-Project Tracking
Setting up and installing the right digital signage software is critical for integrating multiple effective project dashboards. Once installed, the software allows you to log in, connect to various dashboards, and push updates automatically, ensuring real-time data is always available and reducing the need for manual updates. Let’s say marketing and operations teams need to share their multiple project metrics; the software ensures their dashboards loop on the screen without any extra steps.
Using cloud-based digital signage platforms also improves accessibility. Teams can create dashboards, customize layouts, and schedule updates for real-time visibility. With this setup, managers can communicate important information to the entire office, enabling faster decisions and better collaboration across departments.
Real-time visualization includes interactive pie charts, graphs, and widgets, such as Gantt charts and Kanban boards, for enhanced project timelines tracking, all of which are supported by AIScreen’s digital signage platform and templates.
Take your workflow further by learning how to share project management dashboards to digital signage for real-time team updates and centralized reporting.
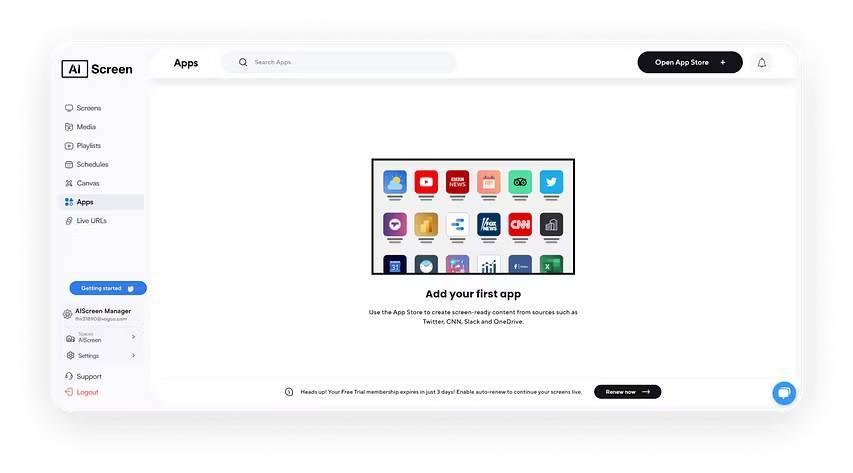
Step 3: Connect Your Display to the Digital Signage System
Connect your display to the AIScreen digital signage platform by installing the AIScreen player app on a compatible device or smart display. Once the screen is registered in the AIScreen dashboard template, you can easily digestible format publish and manage content remotely from a centralized CMS.
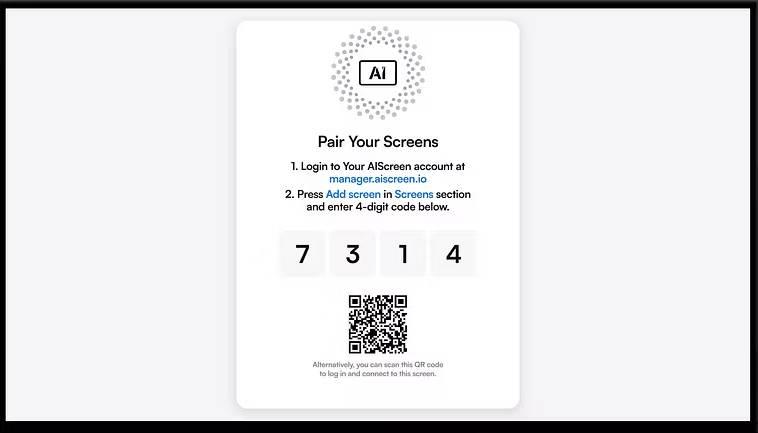
Step 4: Integrate Project Management Tools with Digital Signage
Integrating popular project management processes tools like Microsoft Power BI, Excel, and Trello to digital signage screens ensures that dashboards update automatically by leveraging powerful tools with key metrics features for seamless integration. This can be done through URLs, APIs, or third-party integrations. Let’s take an example: operations tracks KPIs in Power BI, while marketing logs tasks in Trello. Both dashboards can be displayed together using TV dashboards, providing the entire office with real-time visibility.
Integration also improves collaboration and decision-making. Managers and departments can see project information at a glance, communicate priorities, and focus on specific tasks that matter most. By connecting dashboards across multiple tools, organizations can reduce errors, avoid blocked workflows, and streamline reporting. Effective project management tools should also incorporate risk and issue tracking features to highlight potential roadblocks and monitor project health.
Step 5: Deploy and Customize Multi-Project Dashboards
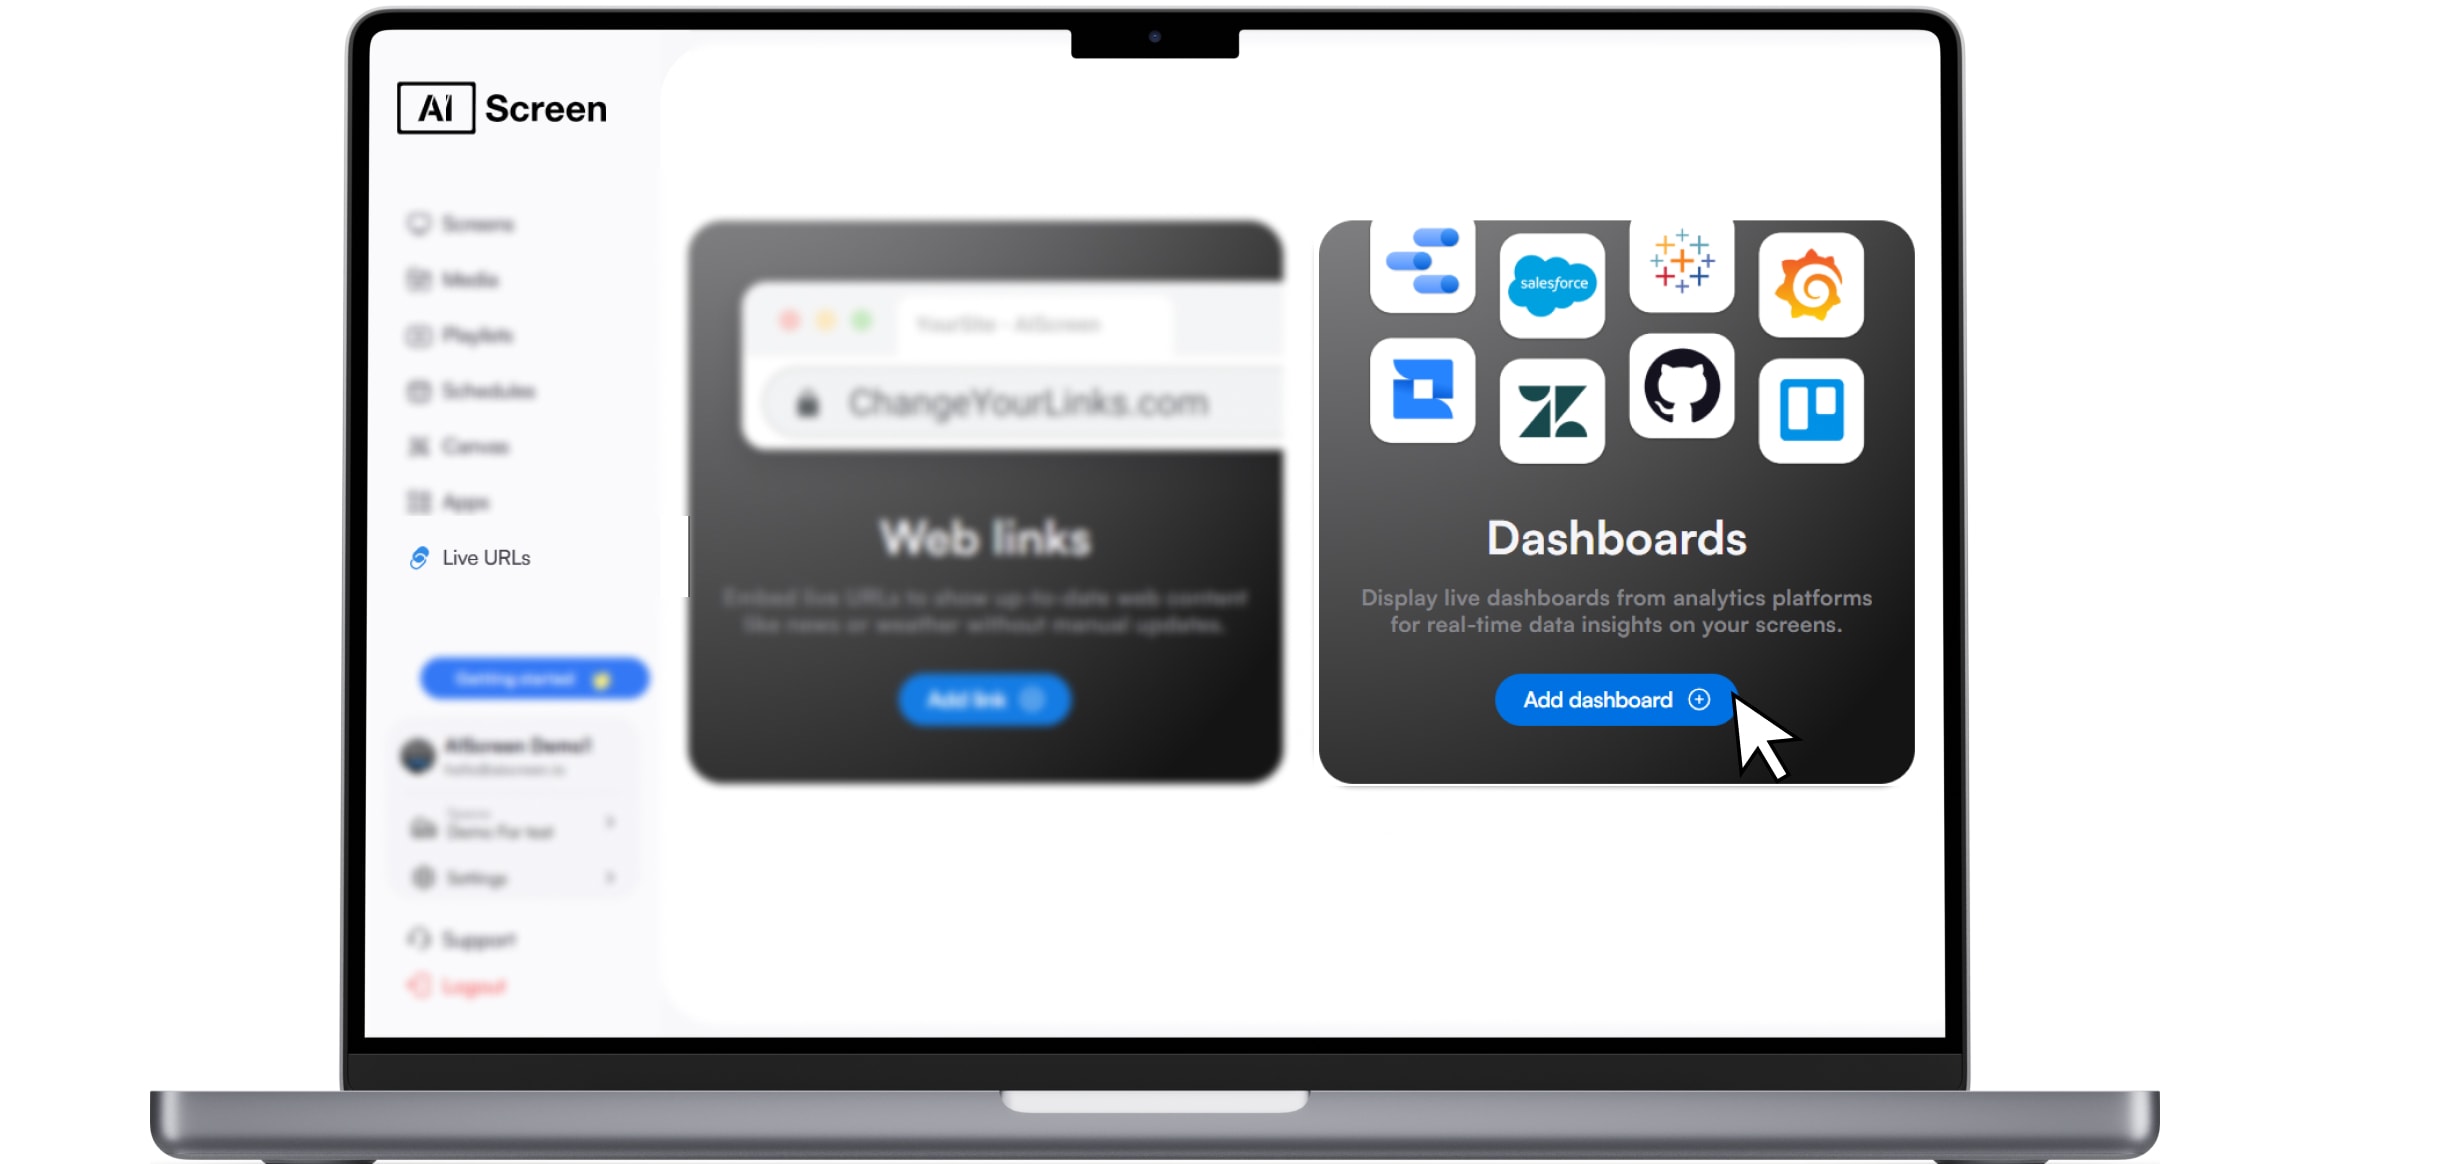
Deploying dashboards on digital signage screens is more than just pushing content; it’s about customizing the layout, updating content schedules, and sharing dashboards for maximum impact. For example, a dashboard template showing marketing performance can run in the morning, while operations dashboards loop in the afternoon, keeping the entire office informed throughout the day.
Customization improves team focus and ensures data-driven decisions are based on accurate, up-to-date information. Managers can highlight KPIs, track project progress, and communicate important information visually.
How to Share Popular Project Dashboards on Digital Signage
To share project dashboards on digital signage, first integrate your dashboard platform with a digital signage system like AIScreen. Upload the dashboard using a live URL, embed link, or web app, allowing real-time data such as KPIs, project progress bars, and timelines adherence to appear on digital screens.
Once added, assign the dashboard to specific screens or playlists through the AIScreen CMS. This enables teams to view live project updates across office displays, helping departments stay aligned and informed without switching between multiple tools.
Sharing Microsoft Power BI Dashboards to Digital Signage
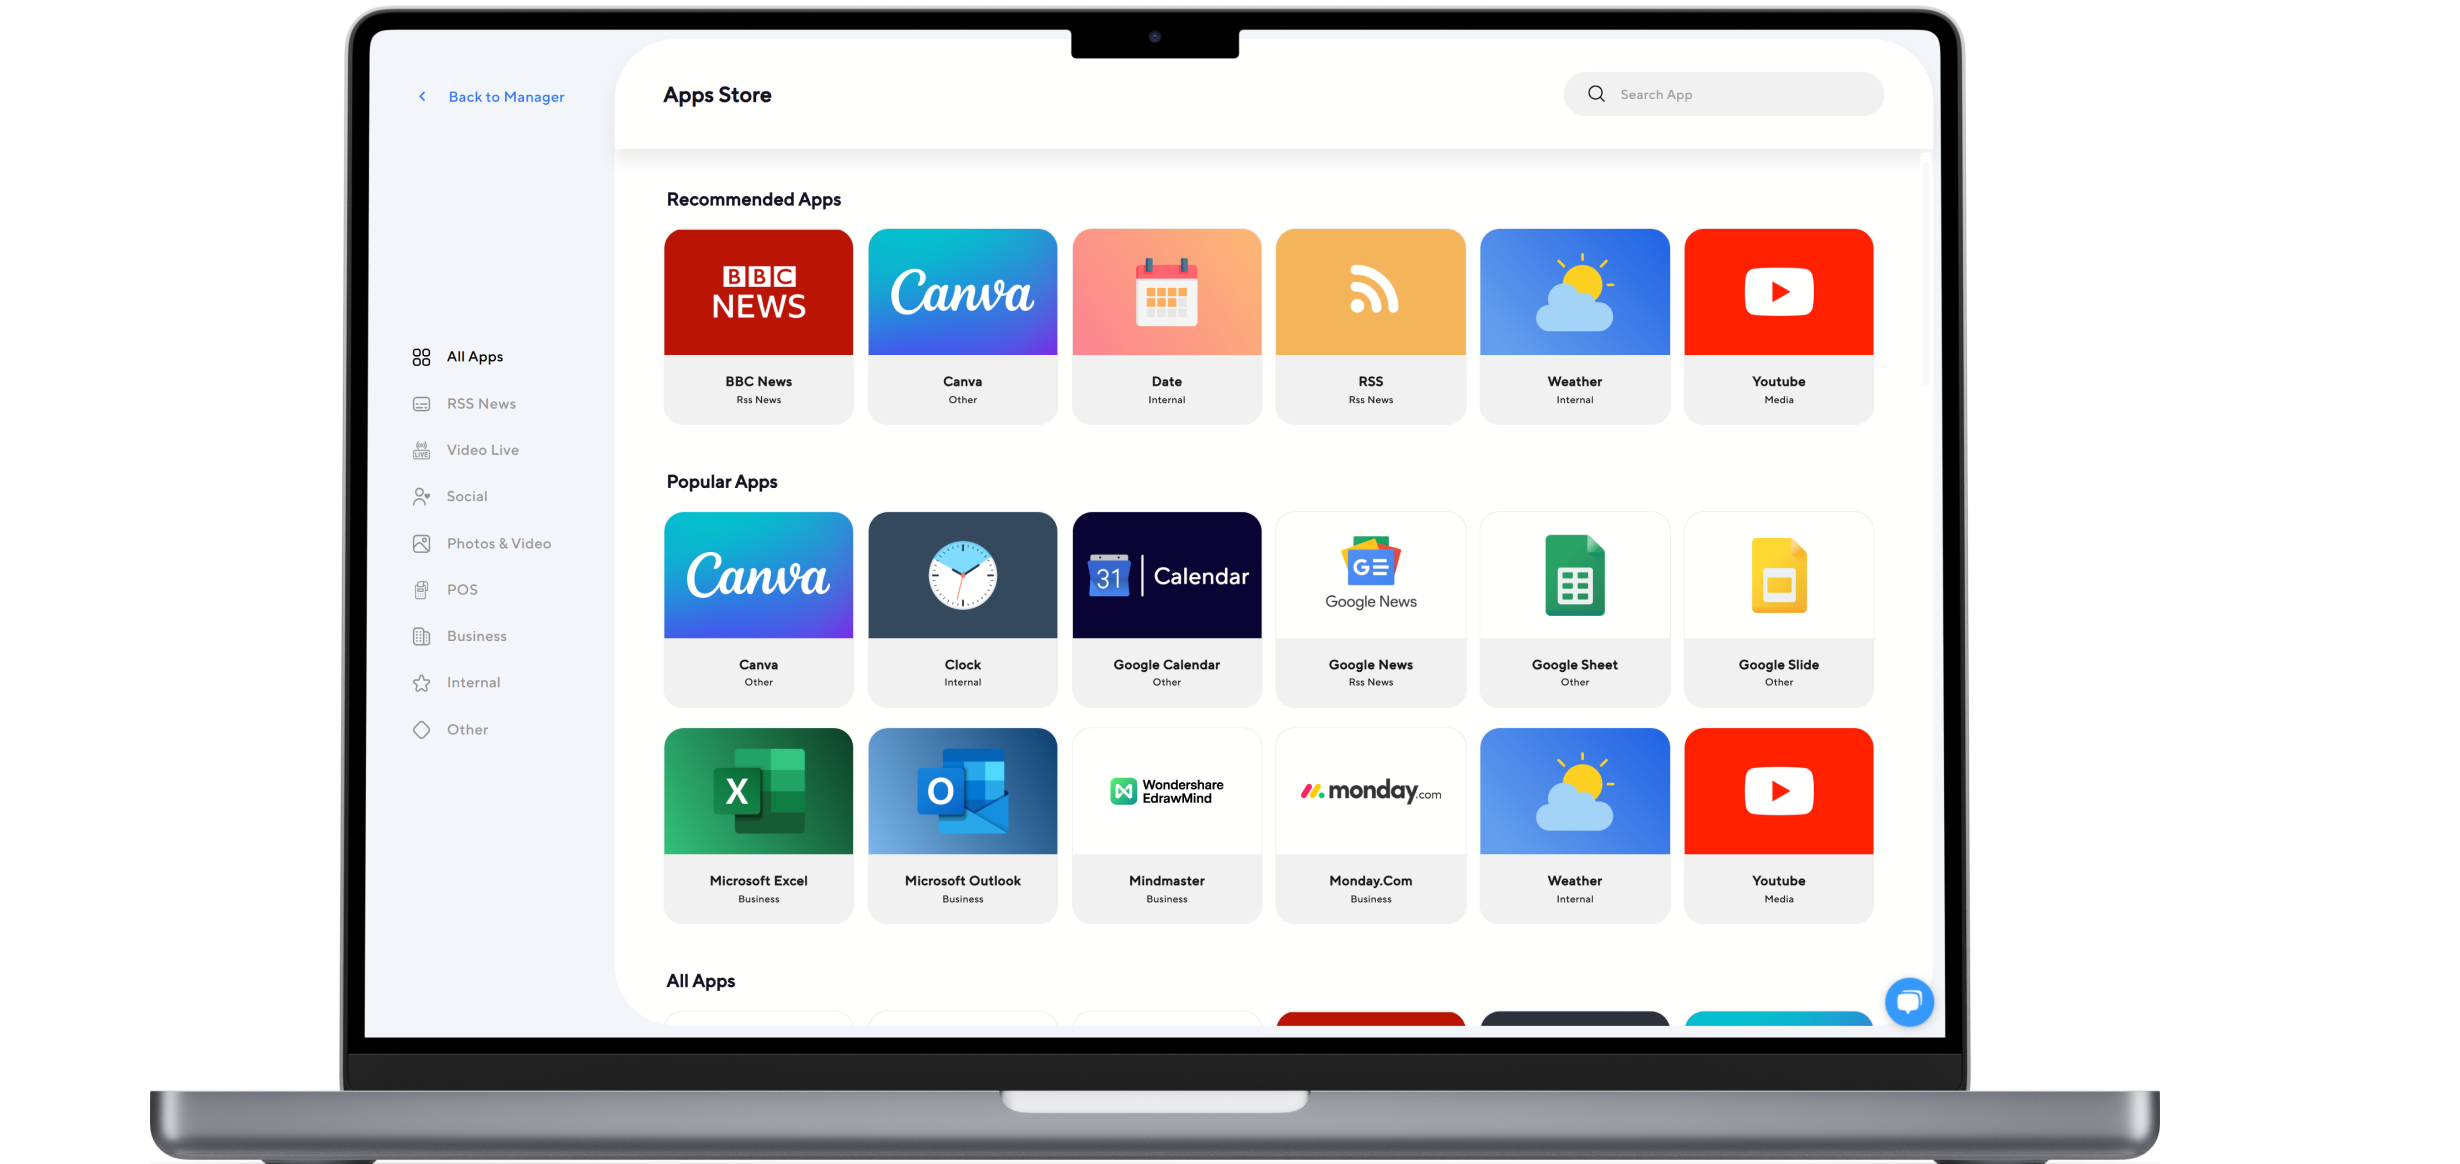
Power BI is a powerful tool for visualizing complex project data, KPIs, and performance metrics. To display Power BI dashboards on digital signage, publish your report, generate a secure shareable link, and embed it into a digital signage platform like AIScreen. This allows live dashboards to appear on office screens, helping teams quickly view project progress bars, deadlines, and resource allocation without logging into multiple tools.
Displaying Power BI dashboards on digital signage also improves decision-making by giving managers and teams instant access to key information elements metrics insights. For example, a project profitability dashboard can highlight which projects, clients, or teams generate the most value. By sharing these reports across office displays, organizations can monitor performance in real time and keep everyone aligned with project goals.
Displaying Excel-Based Project Status Dashboards on Digital Signage

Microsoft Excel or Google Sheets can also be used to create project dashboards and display them on digital signage screens. To do this, organize your critical data, create charts or KPI dashboards, and connect the file to a digital signage platform like AIScreen using a shared link or web view. This allows live project updates, timelines, and performance metrics to appear on office displays.
For example, a product team may update weekly project progress in Excel while the dashboard automatically displays on a large office screen. This improves transparency and helps teams quickly monitor resource allocation, budget vs. actual cost performance, and project status. By sharing spreadsheet dashboards on digital signage, organizations can keep teams aligned and informed without constantly checking emails or files.
How Can Digital Signage Improve Communication in Care Home Communities?
Expanding your signage use beyond dashboards can enhance communication in specialized environments. Learn how to deliver clear, engaging content for residents and staff with How to use digital signage in your care home community for more effective information sharing.
Start Sharing Project Dashboards Seamlessly with AIScreen’s Digital Signage Solution!
AIScreen makes it easy to display project management dashboards on digital signage screens, allowing teams to view real-time KPIs, project updates, and performance metrics across the office. By integrating with popular project management tools, the platform helps organizations eliminate manual updates and share important information with team members, managers, and stakeholders. According to PwC, companies that use visual management tools experience 31% faster decision-making cycles.
With AIScreen, businesses can quickly set up dashboards, customize screen layouts, and manage content from a centralized CMS. This improves collaboration, keeps teams aligned with project goals, and provides complete visibility into progress and performance. By turning office displays into live information hubs, organizations can track progress projects more effectively and support better decision-making across departments.
FAQs
How do I connect my project management tool to digital signage?
You can connect your project phases management tool to digital signage through built-in integrations, secure URLs, or APIs provided by your chosen software. Most platforms make the process simple by allowing you to log into your account and link dashboards directly. Once connected, the data accuracy updates automatically without the need for manual changes. This ensures teams always see the most accurate project milestone information in real time and supports project capacity planning by providing up-to-date insights for better organization.
Can I display multiple dashboards on one screen?
Yes, you can display multiple dashboards on one screen by splitting the display or scheduling them in a loop. Many digital signage solutions let you customize layouts, showing different dashboards side by side for clarity. This way, teams can track different projects or KPIs simultaneously without switching screens. It makes collaboration more efficient and keeps the entire office aligned on shared goals.
What types of dashboards work best for digital signage?
The types of dashboards that work best for digital signage are visual ones with clear KPIs, timelines, and progress updates. Charts, graphs, and project status indicators are more effective than text-heavy reports. They provide quick insights at a glance, which is ideal for large office displays. Dashboards designed for real-time tracking make it easier for managers and teams to act quickly.
How often should I update my dashboard content?
You should update your dashboard content in real time whenever possible to maintain accuracy. With digital signage integration, updates often happen automatically as soon as project management tools refresh data. If real-time syncing isn’t available, daily or weekly updates are recommended. Keeping dashboards current helps teams avoid outdated information and make better decisions.
Is digital signage suitable for remote or distributed teams?
Yes, digital signage is suitable for remote or distributed teams because cloud-based platforms allow dashboards to be shared across multiple locations. Managers can push updates from a central hub system to screens in different offices worldwide. This ensures all departments stay on the same page, no matter where they’re located. It improves communication, transparency, and collaboration across the entire organization.
How do dashboards help respond to project issues or delays?
Dashboards help identify problems early by tracking critical performance metrics. When issues or delays are detected, teams can analyze the root causes and implement corrective actionable insights directly based on the data shown, helping resolve problems, improve performance, and maintain project need timelines.
How do dashboards help manage team workloads or resource allocation?
Utilization dashboards help manage team workloads by providing visibility into resource allocation, which helps prevent burnout and ensures optimal allocate resource distribution across projects. This allows managers to balance workloads and make informed adjustments as needed.
