
How to Set Up Digital Signage for Business Dashboards
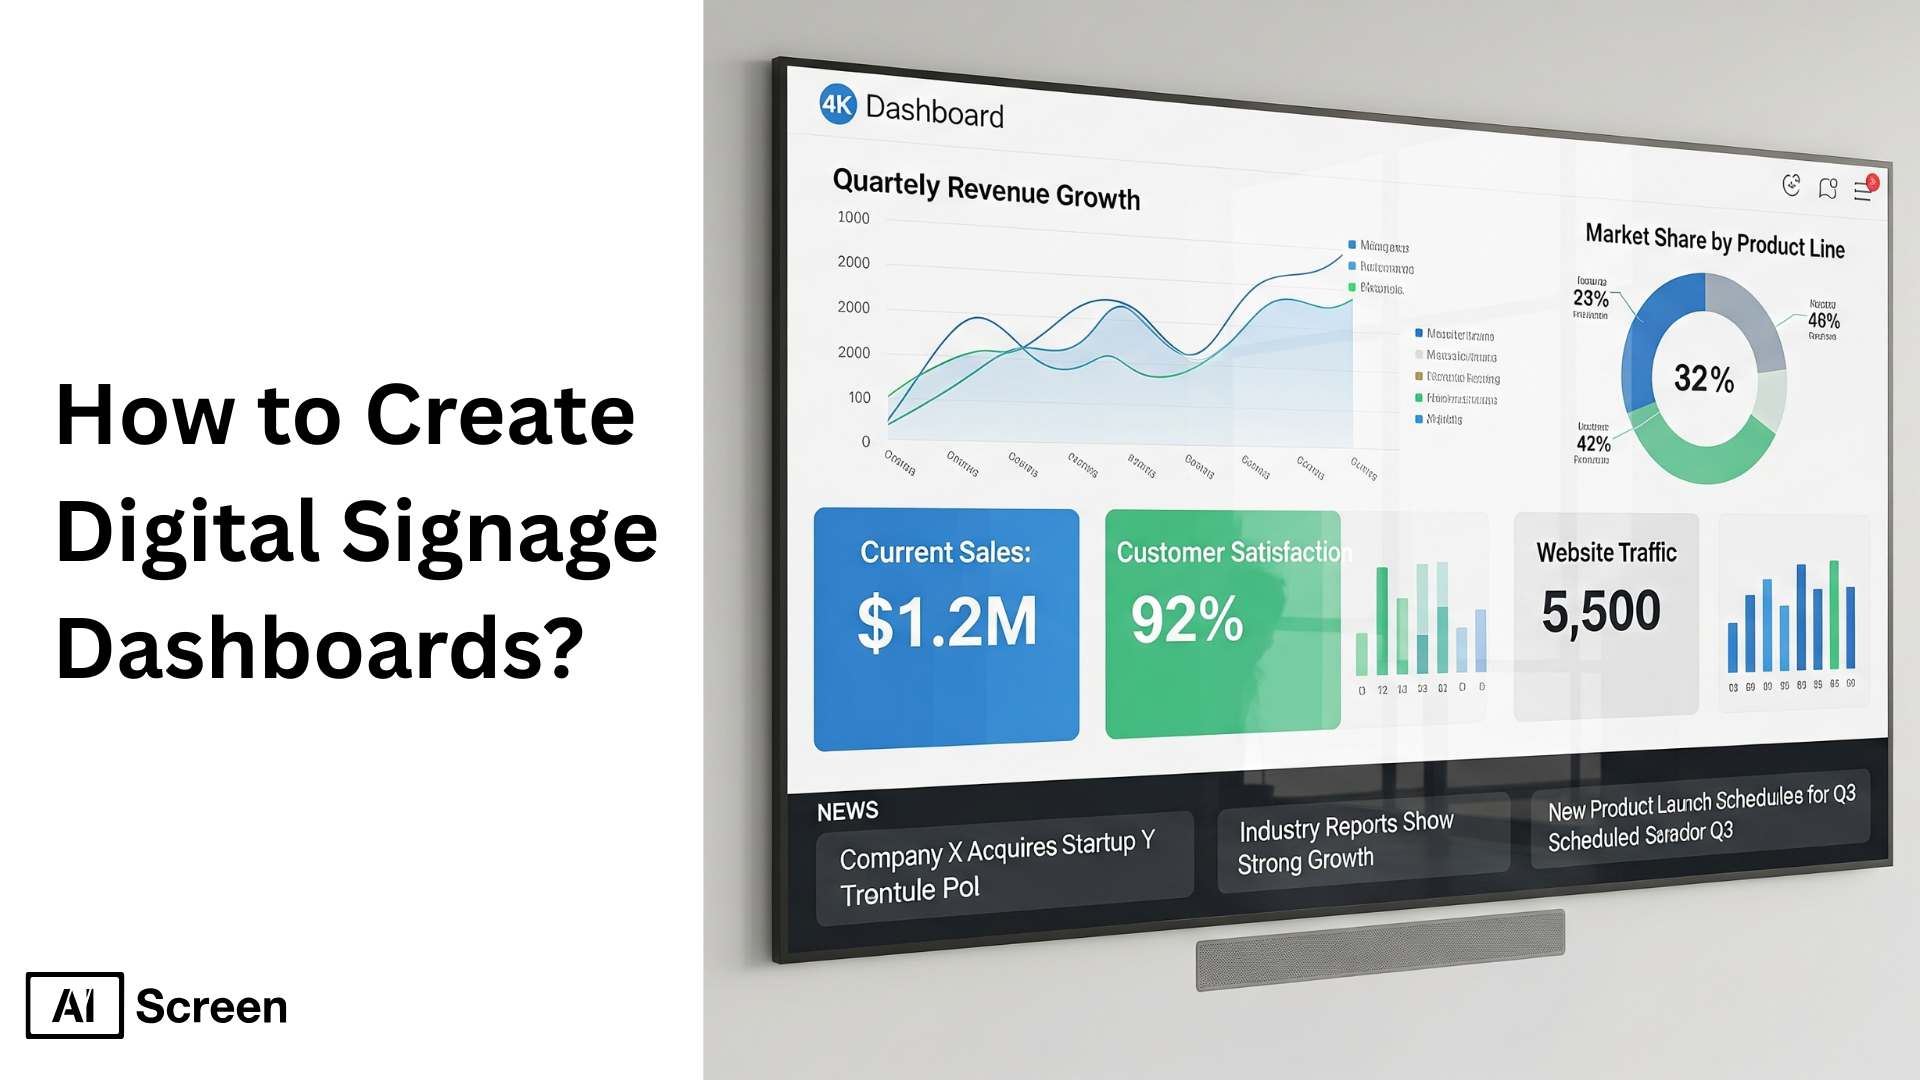
How to create digital signage dashboards might sound complicated, but have you ever wondered how businesses keep live sales numbers? The answer is simpler than you think. To create digital signage dashboards, choose the right digital signage software, identify your key performance indicators (KPIs) and audience, connect your data sources (like Excel or CRMs), design visually appealing layouts in the software or with dedicated design tools, and then deploy and monitor the dashboard to your screens.
In this blog, you’ll learn the exact steps to build dashboards that are not just functional but impactful. From setup to security, and from choosing KPIs to avoiding common mistakes, you’ll see how businesses use signage dashboards to keep teams informed, boost engagement, and make smarter decisions every day.
Create digital signage dashboards step by step, like logging into software Manager, adding your URL, recording steps, handling logins and 2FA, and finally broadcasting your dashboard live. Think of it as your personal dashboard set up guide that ensures everything runs smoothly without manual re-logins.
In this section, we’re going to walk through the process together, so you’ll know not only what to do but also why it matters. Imagine you want your sales performance dashboard to display in your office lobby, or your marketing KPIs on a screen in the team area. With a few clicks, you can make it happen.
Step 1: Open AIScreen Manager and go to Dashboards
The first step is to open the AIScreen Manager and go to Dashboards. Log in to your account with your credentials. Once inside, look to the left-hand menu and head over to the Live URLs section. From there, click on the Dashboards block.
Here, you can either create a new dashboard or open one you’ve already started. This is also the place where you’ll add URLs and begin recording the steps, setting the foundation for a reliable and automated display.

Step 2: Paste the Dashboard URL
In the next step, paste the Dashboard URL to connect to the source you want to display. In the dashboard settings, find the field labeled “Write URL.” Paste the pre-copied link of the dashboard you’re planning to showcase.
This ensures your chosen dashboard, whether it’s a sales report, an analytics view, or performance metrics, is correctly linked and ready for automation.

Step 3: Click Start Recording
In the third step, click Start Recording so the system knows how to re-enter your dashboard automatically. By hitting the “Start recording” button, you allow the software to capture each action you perform, from login screens to navigation steps.
This recording acts like a shortcut, so every time the system needs to re-login, it repeats your exact actions without you having to do it manually.

Step 4: Complete the Login Steps
The fourth step is essential as you complete the login steps just like you usually would. Enter your username and password for the dashboard you’re trying to connect to. If your dashboard requires additional clicks or navigation after login, go ahead and perform those too while the recording is running.
Think of this as teaching the system the “path” you usually take, so it can follow it later without mistakes.

Step 5: Click Stop Recording and Enter the 2FA key (if required)
Once your dashboard is fully visible, click “Stop recording.” If you use two-step verification, paste the key generated by Google Authenticator or Microsoft Authenticator into the field that appears.
This ensures your dashboard can be accessed even with extra security in place, without you having to re-authenticate manually every time.

Step 6: Save and Start Broadcasting
The last step is to save and start broadcasting to bring your dashboard to life on screen. Give the dashboard a clear name (like Marketing KPIs Q3) and click Finish to save.
From here, the extension will automatically repeat the login steps you recorded and keep broadcasting your dashboard in real time. The best part? Your display stays active and accurate even after 24 hours, without the hassle of logging in again.
This means your team, your clients, or even your visitors can always see the latest data, whether it’s sales performance, live KPIs, or website analytics, without interruptions.

Which Tools Are Best for Creating Digital Signage Dashboards?
The tools best suited for creating digital signage dashboards include Trello, Zendesk, Jira, and Salesforce, among others. You don’t have to be a data scientist to set up powerful dashboards. With the right tools and a reliable platform like our software to broadcast them, you can bring KPIs, reports, and insights to life on your screens. Let’s walk through some popular options, with examples of how teams actually use them.
Trello
Trello is often known for task boards, but it can also fuel a simple dashboard view. Imagine a marketing team that uses Trello to track campaign tasks. By integrating Trello with a screen, you can instantly see which campaigns are on track and which are falling behind.
Trello’s card system makes it easy for teams to visualize workflow, and a digital signage dashboard displaying Trello updates can keep everyone aligned without opening the app.
Zendesk
Zendesk is a customer support powerhouse, and its metrics are gold for service teams. For example, you might display real-time Zendesk tickets on a screen in your call center, allowing agents to see the current backlog and average response times.
By using Zendesk dashboards, managers can motivate teams by celebrating closed tickets or improved satisfaction scores. A visual loop of Zendesk metrics ensures support teams always see the pulse of customer service.
Salesforce
Salesforce is the go-to CRM for many companies, and its dashboards are incredibly versatile. A sales team, for example, might broadcast Salesforce dashboards in their office to track revenue goals, pipeline stages, or new deals won. Partnering with a Salesforce outsourcing company can help organizations customize these dashboards to meet their business needs and maximize overall CRM efficiency.
By showing Salesforce insights in real time on digital signage, reps stay motivated, and managers can spot trends faster. The combination of Salesforce data and on-screen visibility makes it hard for teams to lose focus on performance.
Jira
Jira is a developer’s best friend when it comes to issue tracking and sprint planning. Many engineering teams display Jira dashboards on screens in their workspace to highlight sprint progress or open bugs.
By connecting Jira to Signage, developers can see whether the sprint is on pace or if blockers need attention. Jira dashboards ensure accountability, and having them displayed publicly boosts team coordination.
Tableau
Tableau is built for data storytelling. For example, a retail chain might create a Tableau dashboard that shows sales by region, then broadcast it to store managers through screens.
Tableau makes it easy to slice and dice data, and when connected to signage, those insights become more actionable. Tableau dashboards aren’t just numbers; they’re visual stories that help teams make smarter decisions.
Grafana
Grafana shines when you need real-time system monitoring. IT teams often set up Grafana dashboards to monitor server uptime, application health, and network status. Broadcasting Grafana dashboards to a control room ensures that issues get spotted immediately.
Grafana’s flexibility with plugins means you can integrate multiple data sources and still keep everything on one unified screen.
Microsoft Power BI
Microsoft Power BI is another favorite for building interactive dashboards. A finance team, for example, could use Power BI to track expenses, revenue, and forecasts, then display them in the office so leadership and staff are always aligned.
Microsoft Power BI dashboards are easy to customize, and pairing them with digital signage means the whole organization stays connected to financial performance without needing logins.
GitHub
GitHub dashboards might not be the first thing that comes to mind, but development teams use them to display repo activity, code commits, or pull request statuses. Imagine a team broadcasting GitHub dashboards in their workspace, and developers instantly see code health, pending reviews, or contributions. GitHub data becomes a motivating visual that encourages faster collaboration.
Google Data Studio
Google Data Studio (now Looker Studio) is perfect for blending marketing, web, and sales data into one view. For example, a marketing team might create a Google Data Studio dashboard that combines GA4 traffic data, ad spend, and HubSpot conversions.
Broadcasting Google Data Studio dashboards helps the entire team see which campaigns are performing well, without logging into multiple platforms.
How to Build an Impactful Digital Signage Dashboard
Building an impactful digital signage dashboard often comes down to choosing the right KPIs, boosting engagement, and designing for clarity.
Think of it as building a story around your business data that your team or customers can instantly understand when they glance at a digital display. With the right digital signage software, your dashboards don’t just show numbers; they drive decisions. Here’s how to make yours stand out:
- Choose the right KPIs: Don’t overwhelm viewers with too many metrics. Focus on what truly matters—such as sales performance, support ticket resolution, or website traffic. Effective digital signage dashboards keep insights sharp and relevant. If you’re managing multiple locations, highlight KPIs that can be compared side by side. Many organizations use frameworks from how to create a digital signage business plan to select KPIs, ensuring every metric aligns with a measurable business goal.
- Design a layout that guides your audience: A cluttered design can bury even the best insights. Arrange your visuals so the eye naturally flows from the most critical metric to the supporting ones. Use charts, colors, and spacing so your digital signage content tells a clear story. With multiple screens, you can even spread content logically across displays for maximum impact.
- Boost engagement: Static dashboards often get ignored. Adding dynamic charts, animations, or real-time updates makes your digital signage solution more engaging. Imagine walking into a lobby where the digital signage dashboard shows live sales numbers climbing; it grabs attention and motivates action.
- Use video walls: Sometimes one screen isn’t enough. Video walls amplify your signage dashboards and create a wow factor. They’re perfect for boardrooms, control centers, or retail environments where you want big, bold visuals. With centralized content scheduling, you can push updates to all screens at once without breaking a sweat.
At the end of the day, the best digital signage dashboard transforms raw business data into visuals people actually notice. By combining digital signage software with an innovative digital signage solution, you make your dashboards not just informative but impactful.
Why Is a Digital Signage Dashboard a Great Solution for Content Creation?
Digital signage dashboard is a great solution for content creation, you know why? Because it combines data visualization, security, and ease of use, giving marketing teams and content creators the confidence to share insights on any smart TV or digital sign without worrying about leaks.
Beyond displaying live data or project progress, these dashboards streamline operational efficiency and ensure content aligns with business needs while staying secure. Here’s how:
- TV Dashboards Security: TV dashboard security is essential to protect critical data. By using robust protocols like data encryption, role-based access, and secure operating systems, teams can safely share metrics on retail stores’ smart TVs or office screens. This level of protection ensures dashboards reveal only what’s intended.
- Single Sign-On (SSO): Single Sign-On makes life easier for content teams by reducing multiple logins. Integrated with OpenID or SAML, SSO allows you to manage access through existing directories. It saves time, streamlines workflow, and strengthens security, perfect for teams juggling Google Slides, design tools, or other built-in tools to manage content.
- Two-Factor Authentication (2FA): Two-factor authentication adds a second layer of defense, whether through traditional SMS, app-based codes, or modern flash call verification. Marketing teams displaying dashboards across multiple screens can rest easy knowing only authorized users can access them. Whether reviewing resource allocation or machine performance, 2FA ensures maximum enhanced control.
- Data Encryption: With dashboards showing live data and real-time insights, encryption is non-negotiable. End-to-end protection, both in transit and at rest, ensures that regular web pages or a browser-based platform don’t expose sensitive files. It’s one of the key features that keep dashboards secure.
- Data Protection: Strong infrastructure, often built on AWS, ensures dashboards deliver reliably while protecting business data. From remote management of screens to handling project progress, security-first design means content remains safe no matter where it’s broadcast.
- Whitelist IP Addresses: Whitelisting approved addresses makes sure only trusted locations connect to the system. Whether it’s a corporate HQ or a regional branch, this control layer ensures your digital signage solution remains secure while still flexible for operational efficiency.
For content creators, this isn’t just about locking down dashboards; it’s about enabling creativity. With security and access handled, teams can focus on storytelling, pulling in data from Google Slides, regular web pages, or even third-party apps to create engaging visuals. And because digital signage software supports remote management, you can push updates to multiple locations instantly without friction.
How to Troubleshoot Digital Signage Dashboard?
No doubt, troubleshooting the digital signage dashboard is easier than it sounds once you know where to look. Most issues stem from missing setup steps or minor errors that go unnoticed. Here are some simple checks you can make before calling it a day:
- Steps not replaying: If your dashboard isn’t reloading automatically, double-check that every login action was captured during recording. Don’t forget to include the two-factor authentication (2FA) step; skipping it is one of the most common mistakes.
- URL not loading: If the dashboard doesn’t display at all, head back to Step 2 and make sure the URL is copied and pasted correctly. Even a tiny typo can prevent the system from finding the right page.
- Still stuck: Sometimes issues are more technical. If you’ve gone through the basics and the dashboard still won’t cooperate, the next step is to contact the support team directly. They’ll guide you through advanced fixes so your dashboard gets back on track.
Get Started with AIScreen Digital Signage Dashboard
Get started with AIScreen digital signage dashboard today and see how simple it is to bring your data, content, and analytics together in one place. As the leading provider, our software makes dashboard creation easy, helps you monitor content across screens, and delivers powerful insights with built-in analytics.
Whether you’re tracking KPIs, managing multiple locations, or sharing live data, our software takes the hassle out of setup and keeps everything running smoothly. Ready to experience it yourself? Sign up now or start your free trial with our software and unlock a more innovative way to manage dashboards. Contact us.


Frequently Asked Questions
How do I connect live data to a digital signage dashboard?
Connecting live data to a digital signage dashboard depends on the platform you use. Most digital signage software supports integrations with tools like Google Data Studio, Tableau, or Power BI. By linking APIs or embedding secure URLs, you can stream live data such as sales performance, web traffic, or customer support metrics directly onto your screens in real time.
What KPIs should a digital signage dashboard track?
KPIs for a digital signage dashboard often come down to your goals. For example, a retail store might track daily sales, while a marketing team focuses on impressions, engagement, or leads. The key is to select measurable metrics that align with your strategy so your signage dashboards tell a clear story instead of overwhelming viewers with clutter.
How do I ensure accessibility on dashboard screens?
Ensure accessibility on dashboard screens involves designing with your audience in mind. Use large fonts, clear contrasts, and layouts that flow naturally across multiple screens. For teams working in various locations, centralized scheduling also ensures dashboards are consistently updated and visible to everyone, regardless of their device or environment.
What common mistakes should I avoid when creating dashboards?
Common mistakes you should avoid when creating dashboards include overloading them with too much business data, skipping key login steps, or ignoring security features like two-factor authentication (2FA) and encryption. Another mistake is failing to test dashboards on real digital displays before broadcasting; what looks fine on a laptop might not translate well on a smart TV.
How much does it cost to build and maintain a dashboard?
The cost of building and maintaining a dashboard varies widely. Some digital signage solutions, such as AIScreen, offer affordable subscription models, while more advanced setups with video walls or enterprise integrations may incur higher costs. Factor in not just the digital signage dashboard software, but also maintenance, updates, and ongoing operational efficiency needs.
