Digital Signage Analytics for Playback, Audiences and Device Health

Marketing and operations teams track playback, viewers and device health in AIScreen’s cloud digital signage software.

14-day free trial, up to 3 screens, no credit card
Digital signage analytics
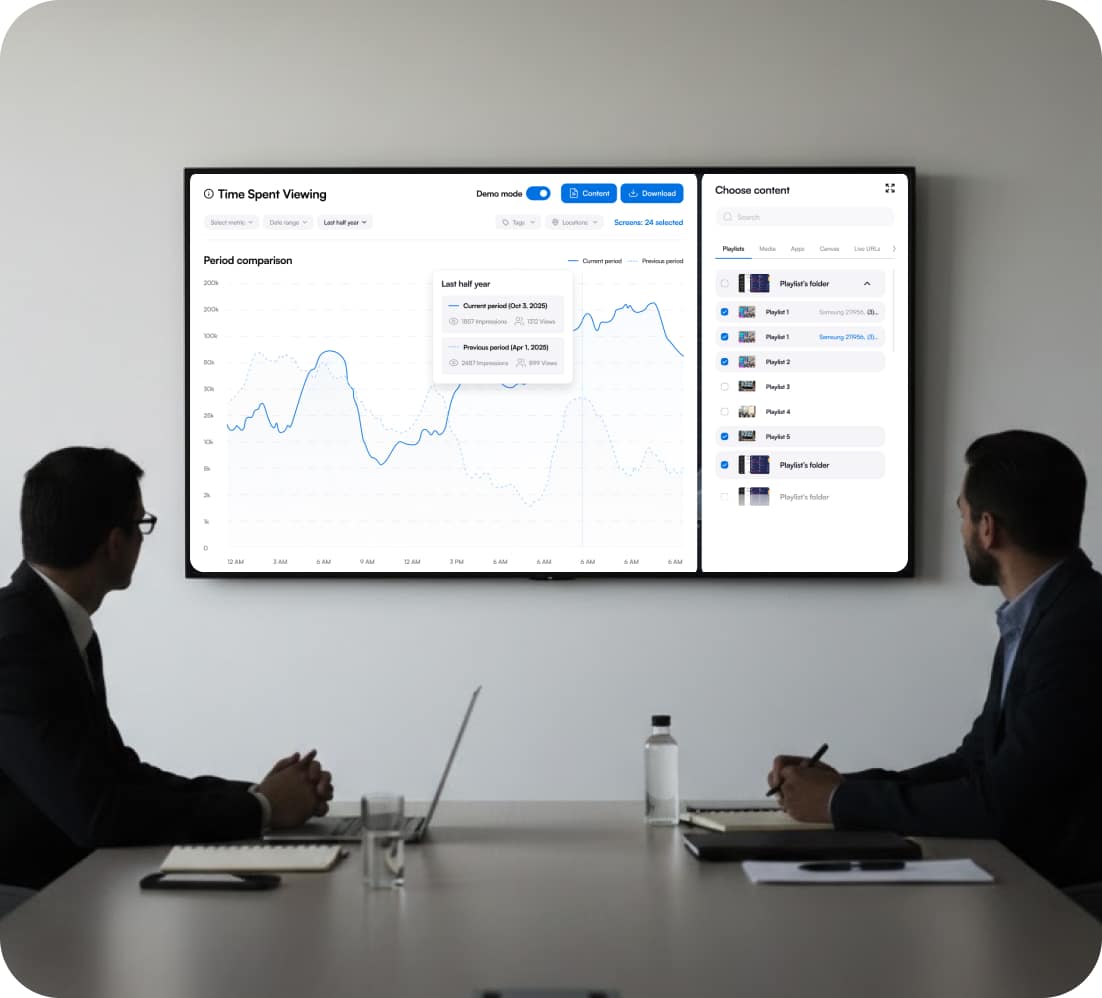
Two colleagues reviewing content on a large wall-mounted touch screen in an office

Digital Signage Analytics That Guides Every Screen Decision

Every digital signage decision gets easier once reports put playback, device health and viewer numbers in one place.

Keep the Slides That Work

Which slides make people stop? Camera view counts next to playback history tell you.

Cut Reporting Time

Sort every screen by status, tag or location on one dashboard, and patterns stand out without a spreadsheet.

Report by Campaign or Date

Build playback reports for one campaign or a chosen date range, then share them with the teammates who plan screen content.

Verify Any Screen Live

Open live screen monitoring to confirm a required notice or price change is actually showing right now.

Digital Signage Analytics Put to Work on Devices, Campaigns and Ads

Keep Every Player and Screen Healthy

Live device status catches dropped connections and struggling hardware before a screen goes dark.

  • Network addresses, storage, memory and temperature for each device
  • Automatic alerts on failing devices
  • Remote system updates and security fixes for devices on older versions
AIScreen screen surrounded by device health panels for CPU and GPU temperature, a screen power switch, Update software and Clear cache

Measure Campaigns by Real Views

Pair the playback schedule with camera-counted views, and every campaign gets judged by real attention rather than airtime.

  • Engaged view rate and content performance for each campaign
  • Foot traffic charts by time of day
  • ROI evidence when budgets move between campaigns
Laptop on a store desk showing a Campaign views bar chart for three campaigns, with a wall screen behind it playing a Spring Sale promotion under a small camera

Show Advertisers What Actually Ran

Proof-of-play records show where and when each ad and scheduled notice ran, down to the screen. Hand those records to any advertiser who asks whether a paid spot really aired.

  • Screen uptime beside proof of play
  • A DOOH advertising module for managing paid campaigns
  • More confidence for brands buying time on your digital signage network
AIScreen dashboard on a laptop showing the Screens list with status, now playing and location

Digital Signage Analytics From AI Cameras That Record No Video

Audience Numbers Processed on the Device

Audience figures in AIScreen come from a camera, either built into an AIScreen display or attached as a sensor to the AIScreen player. No video is ever recorded.

The camera tallies viewers, places them in broad age and gender brackets and measures how long each one looks or lingers, sending only those figures to your dashboard. All analysis happens inside the device, so measurement carries on through an internet outage. Cameras and AI devices come with AI Add-Ons.

Two shoppers walking past a storefront display while an AI camera overlay marks each of them as an anonymous hash with visit time

Digital Signage Analytics Inside a Busy Shopping Center

How It Works at a Shopping Center

Picture a shopping center whose marketing team runs portrait displays along every corridor for events, tenant promotions and directions.
 
Each Monday the team compares last week’s views by corridor. A weekend kids’ workshop drew few looks by the parking entrance but plenty near the food court, so its promo moves there.
 
At the food court itself, a trigger swaps in a student discount when the camera picks up a younger crowd, then returns to the regular loop.
 
When a display goes quiet, the operations desk sees the alert before a shopper or tenant mentions a blank screen. Nobody has to walk the corridors to check.
Shopping center marketing manager checking a playback report on a tablet beside a portrait display with a camera on top showing a coffee promotion

Digital Signage Analytics Alongside Other AIScreen Use Cases

  • Live KPI Boards for Factories

    Production teams put output, downtime and targets on shop-floor screens, so every shift sees the numbers as they change.

  • Turnkey Screens From One Vendor

    AIScreen ships displays, players and software together with setup help and support, so a new site only has to plug the screens in.

Ready to Put Digital Signage Analytics on Your Screens?

Walk through the reports with our team, or try them yourself with a 14-day free trial, up to 3 screens, no credit card.

Digital Signage Analytics FAQs

What is digital signage analytics?

Digital signage analytics is the reporting side of running screens: what played where and when and whether each device stayed online. With a camera, it also shows how many people looked. It lets the next playlist change rest on evidence instead of guesswork. Teams use it to judge content, plan budgets and keep every display running.

Why is digital signage analytics important?

Digital signage analytics is important because an unchecked screen can loop an expired promo, sit offline for days or run an ad nobody notices. Reports surface each of those problems early, while the fix is still a quick playlist change. Without them, the first sign of trouble is often a customer pointing at a dark screen.

What data does digital signage analytics track?

Digital signage analytics in AIScreen tracks three kinds of data. Playback data records what ran on each screen. Device data shows whether players are online and healthy. Audience data, which needs an AI camera, counts the people in front of a screen and how they engage. Seeing all three together means a dip in views can be checked against whether the screen was even on.

Can digital signage analytics update in real time?

Digital signage analytics in AIScreen does update in real time, right inside the built-in dashboard. A display that drops offline or a campaign that stops drawing views shows up right away instead of in a month-end review.

How does analytics improve performance?

Analytics improves performance by showing which slides earn attention and which screens keep failing. A side-by-side visualization of both makes the weak spots hard to miss. Teams swap out the weak content, fix the problem device, then check the next report to see whether the change helped. Small, regular changes like these add up faster than a yearly overhaul of every playlist.

Can analytics be managed across multiple locations?

Analytics for every location you run can be managed together, because each location belongs to the same AIScreen account. A regional manager compares stores, branches or campuses side by side instead of collecting figures from each site by email. Head office sees the whole network, while each site manager can focus on the screens in their building.

Is analytics useful for different industries?

Analytics is useful in any industry where a business relies on screens, from retail chains and restaurants to fitness clubs, event venues and offices. A restaurant checks which menu promo gets noticed, a gym confirms class schedules are showing, and an office makes sure safety notices ran. The reports work the same way whatever the screens are showing.

Does digital signage software offer remote management capabilities?

Digital signage software from AIScreen includes remote device management. From the dashboard you can restart the AIScreen app, fully reboot the device, change Wi-Fi settings, clear the cache or switch screens on and off by schedule, all without a site visit. Many issues get resolved that way before anyone drives out to the screen.

Does analytics require technical setup?

Analytics for playback and device status begins as soon as a screen joins your account. Audience figures also need AI Add-Ons, which add a camera and an AI device to the screen. Book a free consultation to work out which screens actually need a camera.

Is a cloud-based platform a good option for analytics?

A cloud-based platform is a good option for analytics because every site reports into one place. AIScreen runs fully as SaaS, so nothing is hosted on your own servers, and the dashboard opens in a web browser from anywhere.